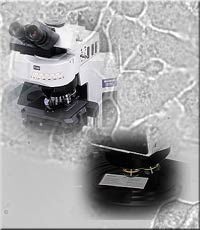
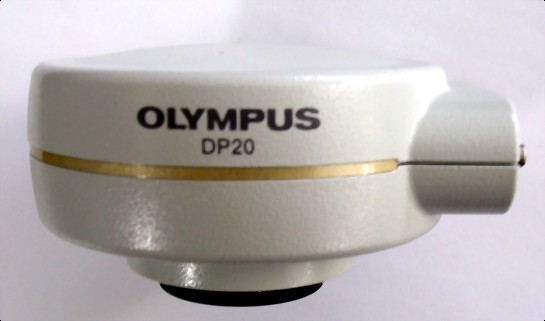
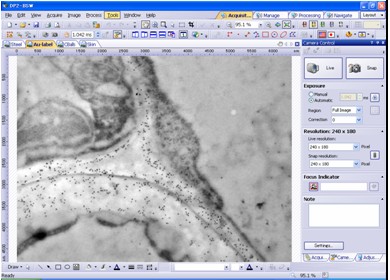
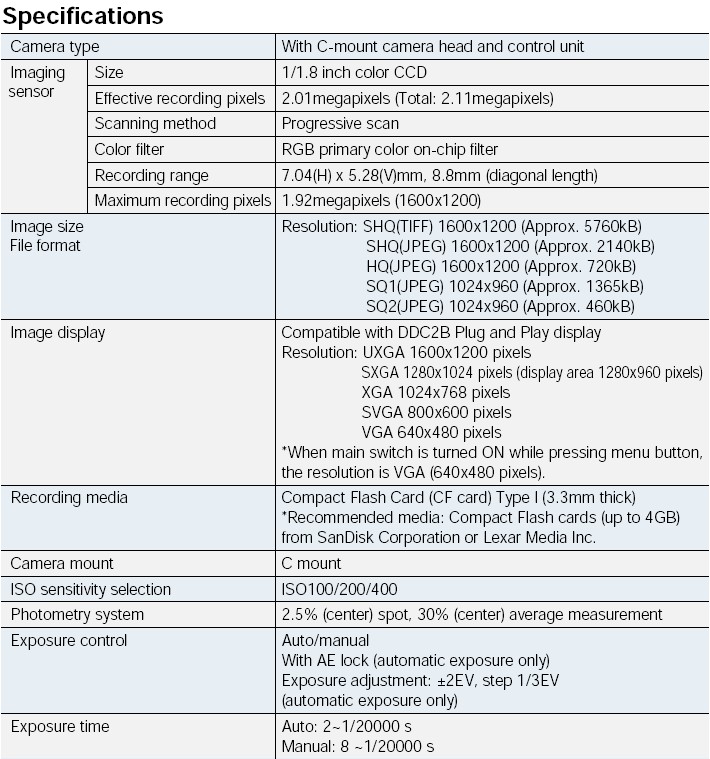
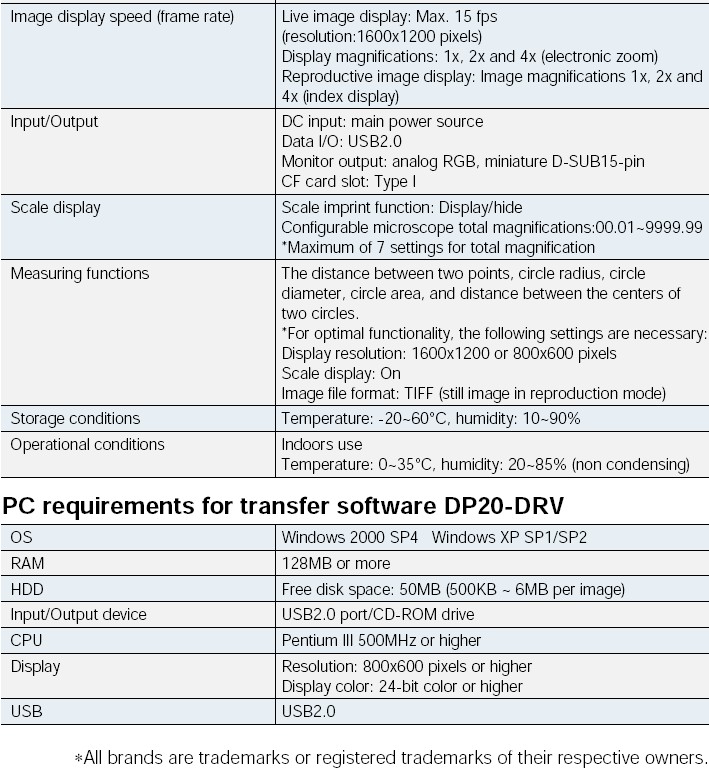
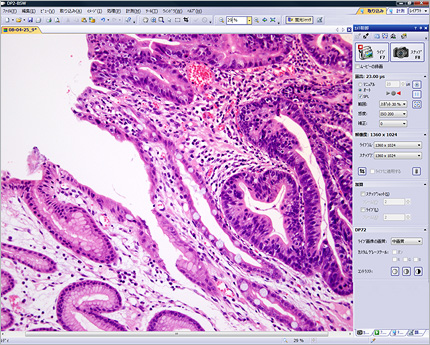
DP20 은 별도의 PCI 보드가 필요 없는 USB2.0 타입으로 편리하게 computer에 연결할 수 있습니다. 또한 별도의 프로그램과 computer가 없어도 바로 모니터에 연결하여 편리하게 사용할 수 있습니다. DP20은 200만 화소를 제공하며 live영상에서도 15frames/sec을 지원하고, DP12와 비슷한 가격으로 더 높은 수행능력을 지니고 있습니다. computer 와 함께 사용하기 위해서는 기본 SOFTWARE인 DP2-BSW를 사용해야 하며 이 software는 거리, 다각선, 사각형, 원 측정이 가능합니다. 또한 anaysis five와 함께 사용하면 보다 다양한 image analyzer의 기능을 수행할 수 있습니다.
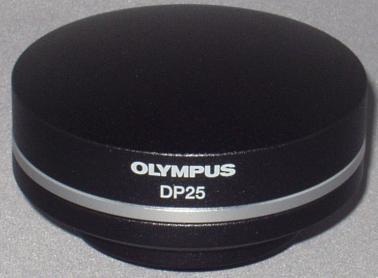
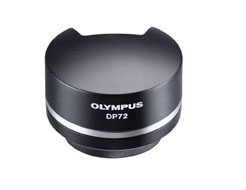
A HIGH PERFORMANCE 5-MEGAPIXEL COLOR CAMERA SYSTEM
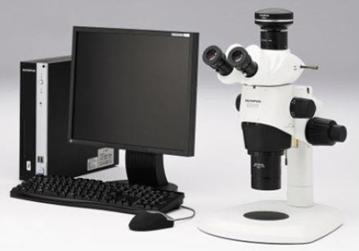
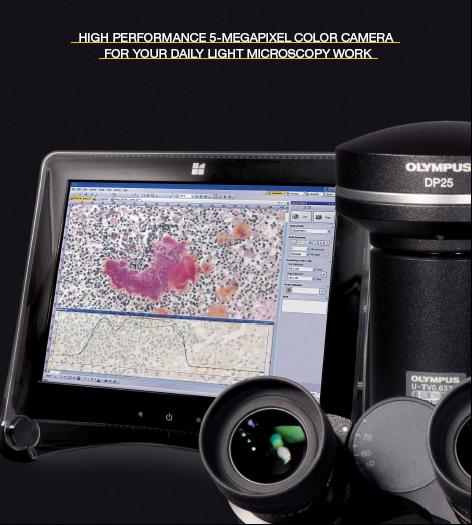
올림푸스의 DP25는 넓은 범위의 과학적인 현미경 이미지 수집을 위한 보고서 및 분석에 사용이 손 쉽게 조작가능한 디지털 카메라 입니다. 고 해상력, 빠른 Frame 속도 또한 색의 표현력이 우수하며 현미경 작업에 효과가 있음을 자신할 수 있습니다.
Features
* High resolution (5M Pixels)
* Fast frame rate (8fps at full resolution)
* Excellent fidelity
* Easy operation DP2-BSW
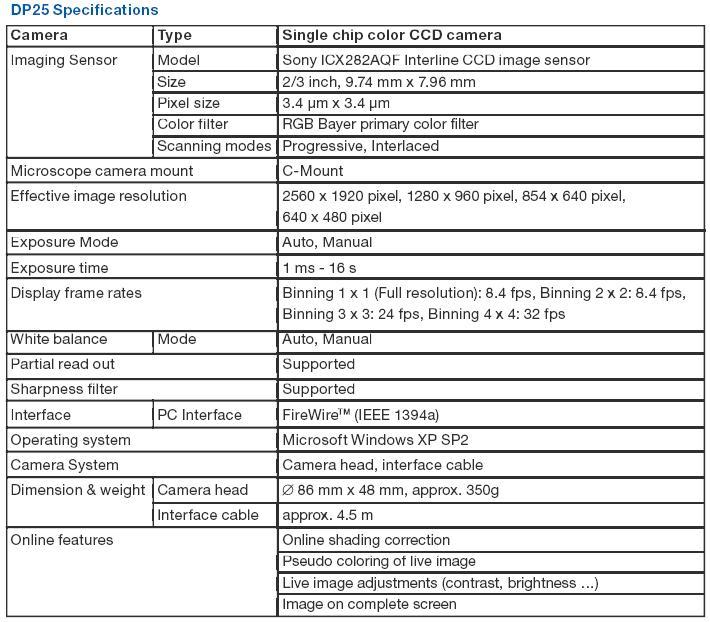
DP25 SPECIFICATION
Perfect images
Automatic exposure
Manual (e.g.brightness, contrast, gamma)
All acquired images are calibrated automatically
Descriptive data (e.g. camera parameters, magnification
Automatic saving
High frame rates
video-like resolution it delivers 30 frames per Second
Good color reproduction
Easy handling
Annotations and scale bar
Interactive Measurements
Several functions for measuring live or still images, including Point measurements, arbitrary line, polygon, circle and ellipse or rectangle measurements, are integrated. For further processing the measurements can be exported to MS Excel with the simple click of a mouse.
“analySIS“제품은 세계적으로 유명한 독일의 영상분석 전문업체인 OLYMPUS Soft Imaging Solution(OSIS) 사에서 제작한 최첨단 영상분석 프로그램입니다.
OLYMPUS Soft Imaging Solution사는 1987년 설립된 후 2006년 4월 OLYMPUS의 일원이 되었고 광학 현미경 및 전자 현미경용 분석 소프트웨어 및 디지탈 카메라 제품을 포함한 영상분석의 모든 솔루션 제공하고 있으며 유럽을 중심으로 다양한 분야에 사용되어 전세계의 많은 영상 분석 전문가와 연구진에게 사랑과 신뢰를 받고 있습니다.
주로 셀 카운팅, 크기 측정, 형광 관찰, 미생물 관찰 등과 같은 기능을 지닌 의학, 생명공학용 image analyzer인 analySIS LS는 다음과 같은 등급으로 구성되어 있고, analySIS LS Report 이상의 등급부터 필요한 module을 추가하거나 제품을 upgrade할 수 있습니다.
LS STARTER : analySIS LS 의 첫 등급으로 형광 합성, 단순 측정과 같은 기능을 제공합니다.
LS REPORT : analySIS LS의 두번째 등급으로서 STARTER의 모든 기능과 data base, report 기능이 추가 되었습니다. 또한 STARTER 이상의 등급부터 필요한 module을 추가하거나 제품을 upgrade할 수 있습니다.
LS RESEARCH : analySIS LS의 세번쩨 등급으로서 REPORT의 모든 기능과 Microscope controller, Multiple Image Alignment (mia), multiple fluorescence imaging, Extended Focal Imaging (efi), Graph 등의 기능을 제공합니다.
LS PROFESSIONAL : analySIS LS의 최고 등급으로서 RESEARCH의 모든 기능과 fft (fast fourier transformation), imaging C Track IT, Colocalisation 등의 기능을 제공합니다.
OLYMPUS Soft Imaging Solution 사의 최신 영상 분석 프로그램인 “analySIS LS” 시리즈는 사용자에게 정확하고 신뢰성 있는 데이터를 얻게 해 줄 것 입니다.
analysisFive LS Starter
analysisFive LS Starter는 entry 등급의 image analyzer로서 다음과 같은 기능을 수행할 수 있습니다.
Image Acquisition
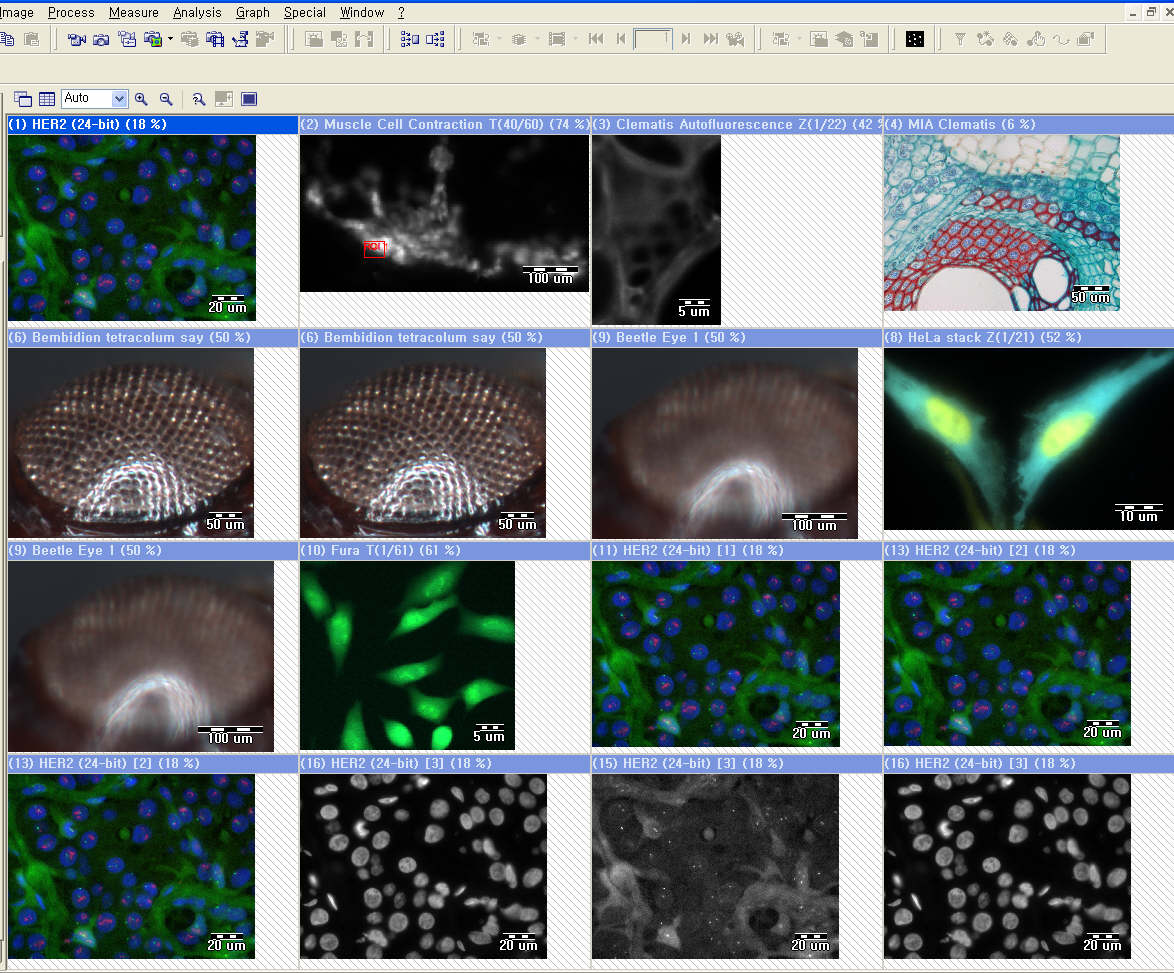
Olympus 및 OLympus Soft Imaging Solution의 모든 현미경용 카메라를 지원하며 완벽한 알고리즘을 통해 뛰어난 영상을 재현합니다. 이를 통해 획득한 영상은 최대 16장까지 동시에 비교 분석이 가능하면 동일 배율 지원, 동일 위치 지원과 같은 최상의 분석 기능을 제공합니다.
[동시비교-최대 16이미지]
Simple measurement
단순거리 측정, 수동 카운트, intensity 분석, 면적 분석 등과 같은 기능이 지원 됩니다.
Multi-channel fluorescence
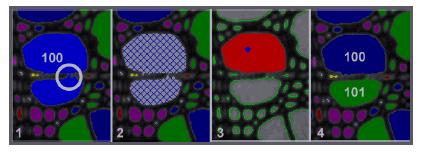
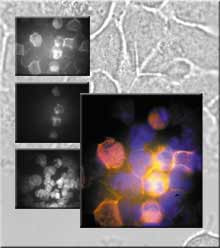
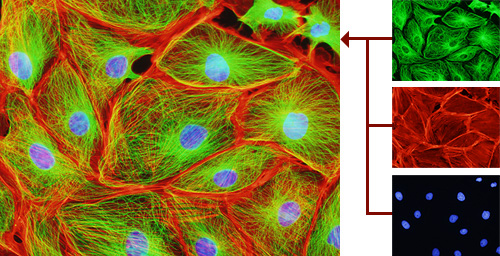
염색된 각각의 대상의 이미지를 한장씩 획득하여 하나의 이미지로 합성하여 쉽게 원하는 영상을 획득할 수 있습니다.
(olysia 홈페이지에서 동영상 파일 옮기기!)
analysisFive LS Report
analysisFive LS Report는 Starter의 모든 기능을 report작성, 이미지, 데이타의 데이타 베이스화 기능을 수행 할 수 있습니다.
Archiving(데이타 베이스)
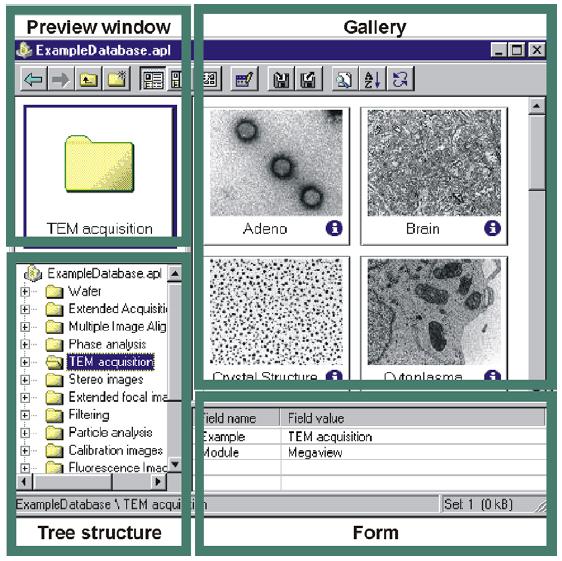
새로운 STructured ARchive (STAR) database 는 이전의 Microsoft Access-style database를 대체합니다. 특히 Windows Explorer-type tree 구조에서 이미지 찾기를 보다 쉽게할 수 있도록 하였습니다. Database Assistant를 이용하여, database 구축을 쉽게할 수 있고 고급 기능을 통해 사용자의 취향에 맞는 정리가 가능합니다. 드래그와 드롭만으로 이 모든 기능이 자동으로 이루어 집니다. 그리고 모든 이미지는 사전에 정해놓은 폴더에 자동으로 저장할 수 있습니다.
(olysia 홈페이지에서 이미지 파일 옮기기!)
STAR databases can be queried in a variety of ways:
•
simple queries of one or more fields with logical Boolean strings and wildcards
•
free queries
•
SQL queries
데이타 베이스는 네트워크를 통해 자동 저장, 백업이 가능합니다.
(olysia 홈페이지에서 이미지 파일 옮기기!)
analysisFive LS Research
analysisFive LS Research는 Report의 모든 기능과 motorized 현미경 제어, new measurement, MIA, EFI 의 기능을 수행합니다.
Microscope & Hardware control
Olympus 현미경 BX61,IX81,SZX12/SZX16를 프로그램에서 제어할 수 있습니다.
이를 위해서는 하드웨어 마법사를 실행하여 motorized 현미경 장치-대물렌즈, 필터, 큐브(형광, dic), 콘덴서-를 구성하고 이는 프로그램 내부의 컴퍼넌트 리스트에서 쉽게 선택할 수 있습니다. 또한 여러 사용자마다 원하는 구성을 셋업도 할 수 있고 한번 셋업된 후에는 프로그램 작동만으로 모든 하드웨어들도 함께 자동으로 제어할 수 있습니다. 이를 통해 형광, 위상차, 편광, DIC 같은 여러 관찰도 한번의 셋팅과 클릭으로 편하게 사용할 수 있습니다.
(olysia 홈페이지에서 이미지 파일 옮기기!)
현미경 대물렌즈를 바꾸면 프로그램은 렌즈의 배율을 자동적으로 읽은 후 알맞은 스케일바를 이미지에 보여줍니다. 그리고 Z축이 motorized 되어 있으면 렌즈 변환시에도 촛점 거리를 자동으로 맞출 수 있습니다.
다음 회사 제품의 motorized stage를 지원합니다. Prior, Ludl, Märzhäuser
다음 회사 제품의 third-party shutters 와 filter wheels을 지원합니다.Prior, Ludl, Sutter, Uniblitz
(olysia 홈페이지에서 이미지 파일 옮기기!)
New measurement
새로운 측정툴은 매직완드, 다각형 측정, 자유 측정과 같은 강력한 기능을 지원하며 측정하고자 하는 값은 113가지가 가능합니다. (길이, 넓이, 반지름, intensity 등) 또한 측정된 값들은 측정 개체별로 통계값을 바로 볼 수 있으며, 아주 간단하게 sheet로 만들어 Microsoft Excel 형식 사용할 수 있습니다.
Dual Screen System
두 개의 모니터를 사용하여 넓은 화면으로 이미지의 분석 효율이 높아집니다.
Graph
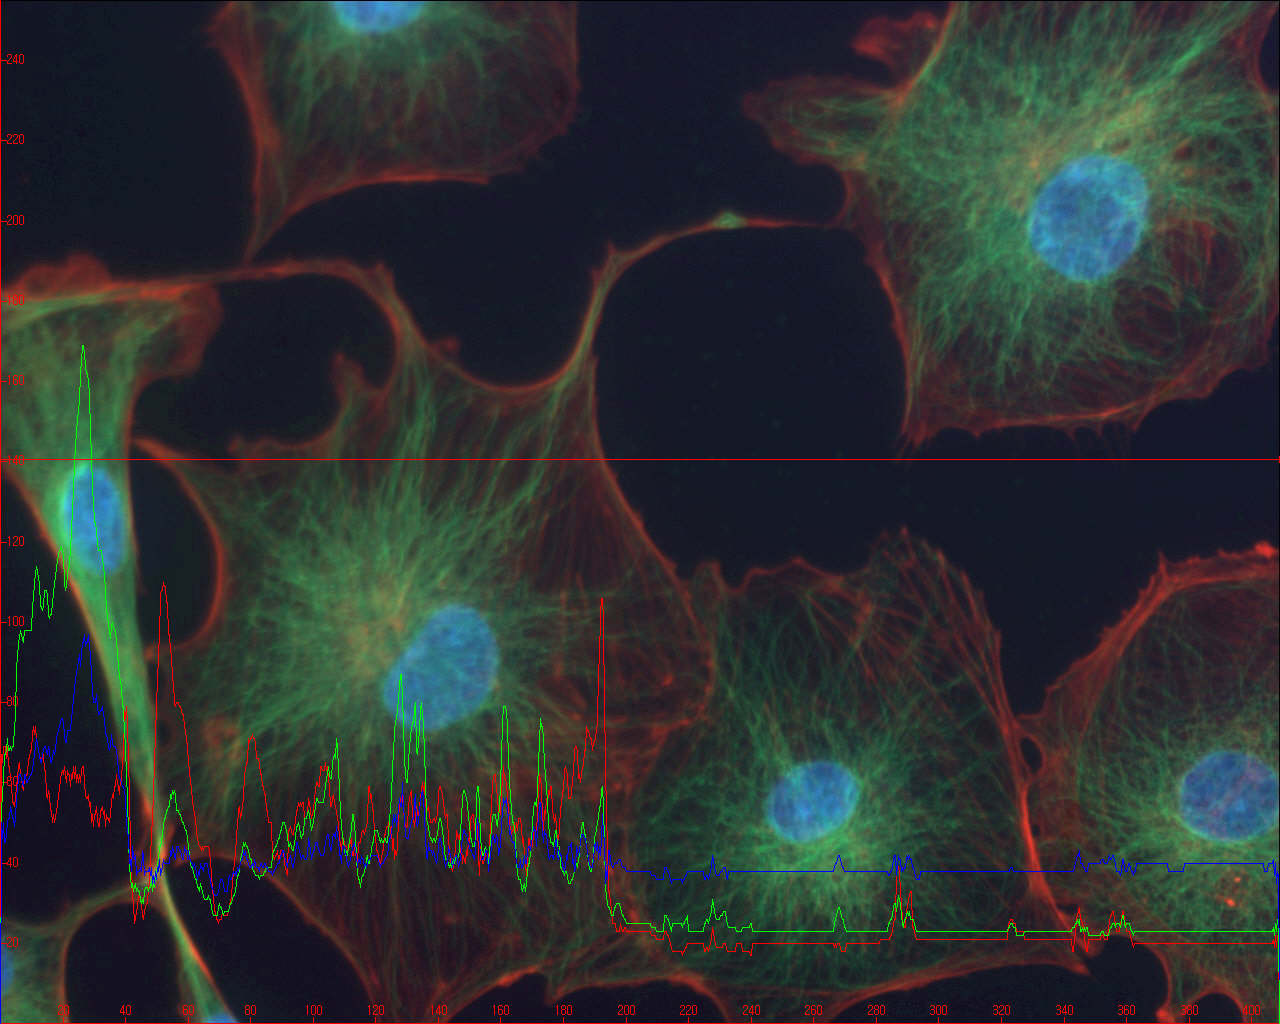
그래프 기능으로 레포트에 충실한 자료로 당신의 레포트 질을 높일 수 있습니다.
fis (Fast Image Acquisition)
고속으로 이미지를 획득하여 빠른 변화를 손쉽게 저장할 수 있습니다.
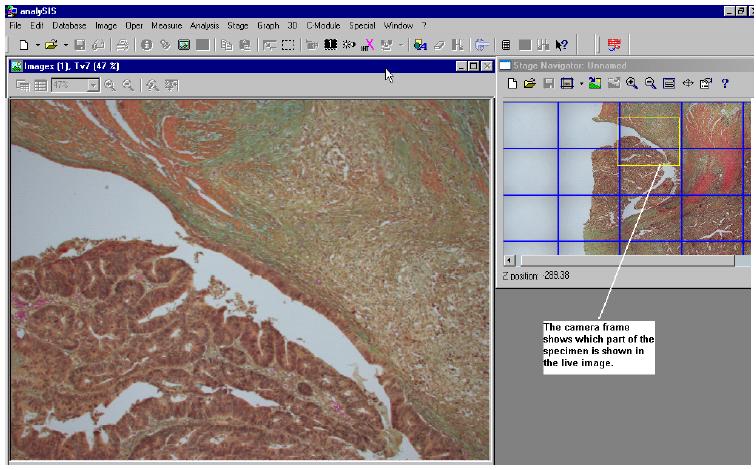
Stage Navigator
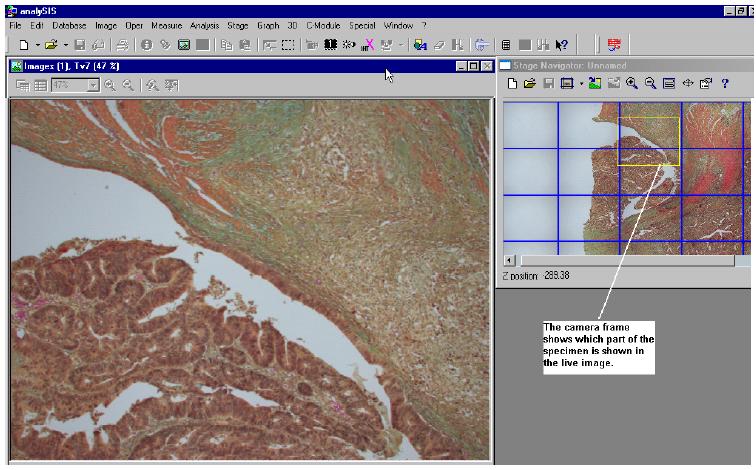
Stage Navigator를 이용하여 원하고자 하는 포인트를 지정하여 빠르고, 정확하게 확인 하실 수 있습니다.
With the Stage Navigator you can acquire overview images of a sample and use them for a precise navigation. This assures that you always know your exact location on the sample. You can recognize interesting areas in the sample, move to them in the live-image, and acquire images with a higher magnification. In the overview image, a “grid within a grid,” enables you to recognize the areas you have acquired with a higher magnification. You can deactivate this display if you want to.
MIA (multiple image alignment) 관 여러장의 사진을 합성하여 넓은 영역을 하나의 파일로 만들어 편리한 관찰이 가능합니다.
Mia works with both monochrome and color images, supports the entire number of file formats in analySIS®, and includes an intelligent image acquisition mode with automatic calibration of the camera and camera and/or image rotation.
Once this has been defined, all you need to do is to make a decision about the required image size and resolution. Stage movement, image acquisition and the computation of the optimum overlap are done automatically by the software.
To effect the image montage, the individual images have to be aligned with sub-pixel accuracy. mia achieves this through intelligent pattern recognition techniques and plausibility checks within the overlap areas.
The resulting image has the same resolution as the individual images but is larger. It has more lines and columns. It thus represents an image that could not be acquired without mia with high resolution and large field of view.
How does Mia work?
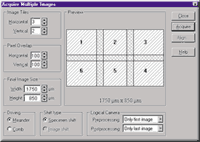
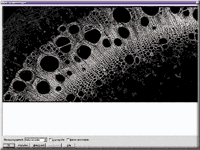
1. The integrated image acquisition control allows the automatic acquisition of individual images; image rotation and stage displacement are automatically determined.
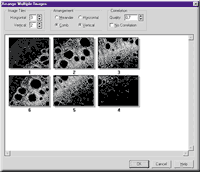
2. This example uses six individual images for the Mia process. There are no limits to the number of images Mia can process in one session. The number of images you actually use is dependent only on the storage capacity of your computer
3. After image acquisition, you can manually determine the number, pattern and correlation of the individual images. In the case of automatic image acquisition, these parameters will be preset for you.
4. After Mia has processed the images, the overlap areas can be adjusted automatically for differences in intensity.
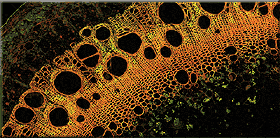
The result of the Mia process:
The end result (reduced to 0.7% of its actual area)
Image size: 2159 x 1062 pixels in 24-bit true color.
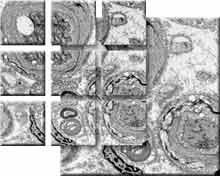
Nine image sections, each 1024 x 1024 pixels in size, automatically stiched together by the module Mia.
The high resolution 3300 x 3300 pixel sized full view image shows healthy and degenerated nerve cells.
EFI (extended focal imaging)
Focal depth 가 다른 이미지를 하나의 이미지로 합성하여 또렷한 이미지를 얻을 수 있습니다.
Microscopy at unlimited depth of focus
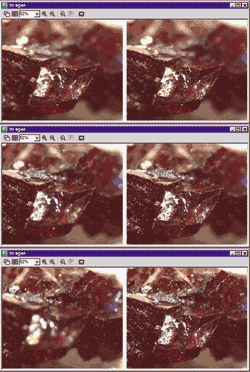
By using the efi module, you can solve a known and limiting problem of light microscopy: Microscopes in general have only a very limited depth of focus. Details which are visible in separate images with different focus settings are normally not visible in one single image.
efi records images with different focus settings and extracts those parts of the image that are in focus. Mounted into a single image, these details combine to create an image with unlimited depth of focus.
efi supports the automatic montaging of both color and b/w image series. Optionally, you can reconstruct a height map from these images. Used in live mode, efi provides both a live image as well as the partially reconstructed image. Missing details can be focused interactively and added to the current image.
efi automatically aligns images that show a lateral displacement, such as if the images were taken with a stereo microscope. Anoptional motor stage control provides the added advantage of automatic image acquisition and efi processing.
Live-image and Real-time calculated recombination of image
Reconstructed image
efi circumvents the physical limitations of a microscope regarding its depth of focus. A number of images are recorded, each one with a different focus setting. The parts of each image that are in focus are extracted and combined into a single, focused image.
efi allows the combination of images with lateral displacements caused by different focus settings. This is a common effect when using a stereo microscope to capture the images. Before calculating the efi image, an integrated pre-alignment step shifts the images so that they overlap perfectly. Only after this alignment has been achieved does efi calculate the final image.
Heightmap of the reconstructed image
Surface reconstruction
efi image surface reconstruction combined with the heightmap
efi provides the option of calculating a height map from individual images. This height map can be used to produce a 3-D representation of the object. As an optional feature, the efi image can be used to texture the height map, creating a realistic topographic representation of the object’s surface.
A number of powerful functions for animating the 3-D structure within analySIS® enable the user to study the object from an optimal angle and position.
Live-image and Real-time calculated recombination of image
Reconstructed image
Recombination of a focus series of a metallurgical sample. The recombined efi image is necessary for conducting advanced analysis.
efi allows the concurrent visualization of the live image directly from the microscope and the current recombined image. Areas that are still unfocused can be added interactively.
A simple addition of more images, even if the original acquisition was finished, allows adding further focused details to the image.
Live-image and Real-time calculated recombination of image
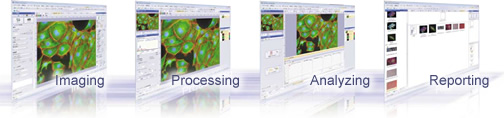
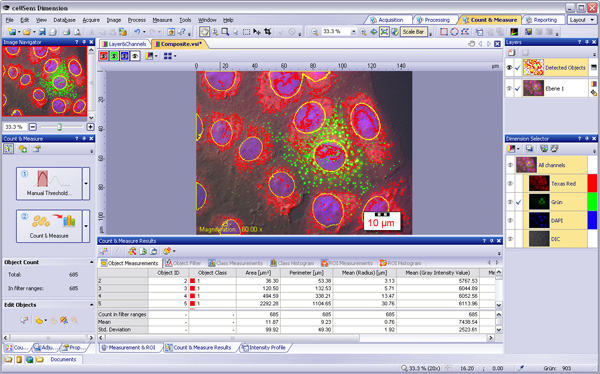
이미징의 미래에 오신 것을 환영합니다. cellSens에 오신 것을 환영합니다. 신뢰할 수 있는 영상 획득 및 저장의 영상 캡쳐 소프트웨어 혹은 자동화된 멀티 채널 이미징 연구가 필요하다면 새로운 cellSens 소프트웨어는 가치 있는 이미징 실험을 위한 최상의 솔루션을 제공합니다.올림푸스 cellSens 플랫폼은 작업의 흐름에 기반한 유일한 개별화 및 직관적인 이미징 경험을 생성합니다. cellSens로 PC 상의 아이콘들과 툴바를 통하여 간단하게 제어가능하고 생산성을 향상할 수 있습니다.cellSens는 사용하기 쉽고 강력하고 유연합니다. 모듈화 방식의 디자인으로 여러분의 예산 및 이미징 어플리케이션에 대한 대응이 쉬워 여러분의 발전된 연구와 함께 cellSens도 성장할 것입니다.
특징 및 이득
cellSens 소프트웨어는 Biological 영상의 캡쳐, 출력 및 분석을 위한 쉬운 커스터마이징이 가능한 디지털 이미징 소프트웨어 입니다. 유일한 MyFunctions 툴바와 쉽게 개인화가 가능한 desktop으로 cellSens는 여러분이 가장 필요로 하는 영상 획득 및 분석 요구에 대한 기능성, 유연성 및 측정성을 제공하는 끊김없는 작업환경을 생성합니다.
● 커스터마이징
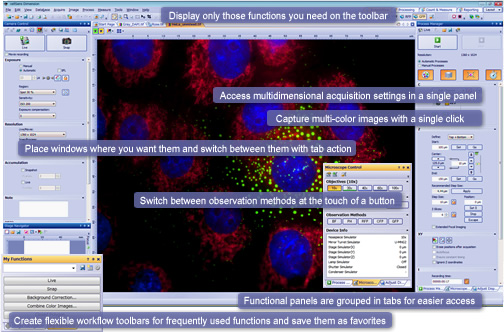
새로운 완전한 커스터마이즈 인터페이스는 사용자가 각각의 작업 흐름을 더욱 효과적인 이미징과 측정 진행 제공을 가능하게 합니다. 획득 (Acqusition), 처리 (Processing)와 측정(Measurement)를 위한 레이아웃 탭은 그러한 기능이 필요할 때 필요한 기능을 접근 가능하게 해 줍니다. MyFunctions 작업흐름(workflow)툴바는 진행 지향의 작업 흐름을 간단하고 사용하기 쉽게 만듭니다. 또한 메뉴와 툴바는 완전하게 커스터마이징이 가능하고 문서와 도구 패널 또한 각각에 맞게 재 정렬 할 수 있습니다.
● 획득 및 장치 제어
cellSens는 이미지 획득과 하드웨어 자동화 장비를 다양하게 제어합니다. 올림푸스, Hamamatsu, QImaging 과 다른 카메라 브랜드들을 지원하여 최상의 유연성을 제공합니다. 자동화된 획득 역시 간단합니다. 작업 매니저는 자동화된 올림푸스 현미경과 주변 장치들로 직관적인 Multidimensional 이미징 경험으로 바꾸어 줍니다.
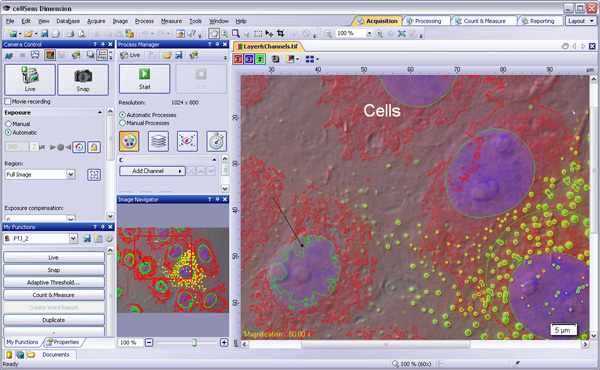
Acquisition Layout에서 모든 영상 획득 기능을 쉽게 접근 할 수 있습니다.
● 영상 출력 및 처리
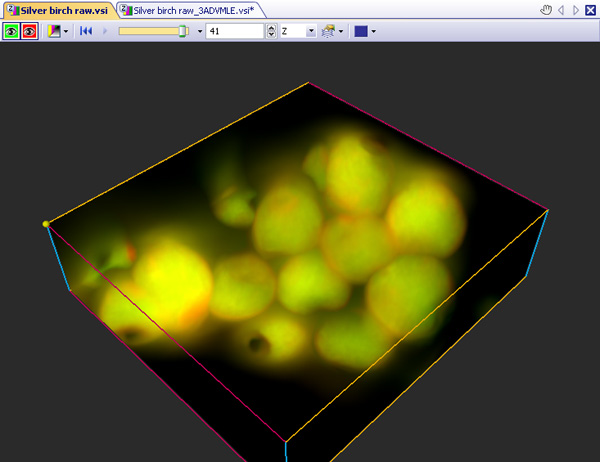
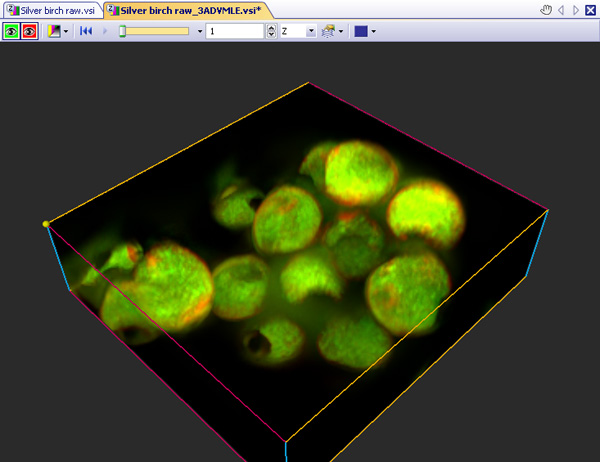
영상 출력 및 처리 도구들은 정밀하고 효율적인 이미지 분석 수행을 위한 결정적인 요소입니다. 다양한 데이터, movie playback, projection, montage 혹은 slice view와 상호 연계가 됩니다. CI Deconvolution 모듈의 Voxel Viewer로 더 나은 3D 기능을 얻을 수 있으며 multiple widefield 및 컨포컬 이미징 처리를 위한 Advanced Constrained Iterative Deconvolution 알고리듬으로 업계 최고의 속도로 최신의 현미경 영상 deconvolution 기술을 제공합니다.
다중 출력 도구로 빠르게 데이터를 리뷰 할 수 있습니다. 레이어와 채널을 on/off 토글함으로서 관심있는 데이터에 주안점을 줄 수 있습니다.
● 영상 분석
cellSnes는 기본적인 점간 측정에서 상분석부터 고급의 형상 분석 및 다중 개채 분석까지 많은 영상 분석 요구들을 처리하는 분석도구를 제공합니다. cellSens에서 사용 가능한 적절한 도구들로 Colocalization 및 Linear Unmixing를 처리할 수 있습니다.
● 협력
사용자가 대 규모의 데이터를 획득하기 위한 수집된 이미지, 측정 및 주석 정보의 저장 및 회수 기능은 매우 중요합니다. 완전하게 커이터마이즈 가능한 SQL Server Express 기반의 데이터베이스는 로컬 혹은 네트워크상에서 운용됩니다. NetCam 모듈 (연구 및 교육 용도의)은 실시간 이미지를 인터넷을 통하여 제공하여 동료와의 협력을 가능하게 합니다. Olympus 웹사이트에서 다운로드 가능한 무료의 cellSens Viewer 소프트를 사용하여 동료와 오프라인상의 협업도 가능합니다.
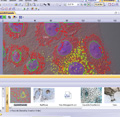
데이터베이스 모듈은 대용량 데이터의 관리를 단순화 합니다.
사용 가능한 패키지
cellSens 소프트웨어 – 요구와 예산의 다양성을 위한 다 단계 패키지
1. cellSens Dimension – 포괄적인 이미징 솔루션
올림푸스의 완벽한 이미지 획득, 처리, 보기 및 분석 솔루션으로 기본 패키지와 여러 개의 추가 솔루션을 제공 합니다.
유연하고 직관적인 획득 – 하나의 이미지 혹은 다채널, x/y/z 및 시간 이미지 획득 여부에 상관없이 이미지 획득은 간단합니다. cellSens Dimension의 표준 패키지는 시간간격 (Time lapse), Z-stack 및 멀티 포커스 이미지 (EFI)가 있습니다. 또한 포함된 NetCam 모듈(연구 및 교육을 위한)은 동료들에게 실시간의 실제 이미지를 스트리밍 할 수 있습니다.
완벽한 처리, 분석 및 보고서 도구 패키지 – cellsens Dimension은 kernel 필터, 개체 임계값 및 상 분율을 포함한 진보된 처리 및 분석 기능들을 제공합니다. Microsoft사의 Word을 위한 플러그인을 사용하여 여러분의 데이터로 전문적인 보고서를 생성하십시오.
이 패키지의 옵션의 확장 모듈들:- Multiposition Acquisition – Count&Measure Advanced – CI Deconvolution – Database
2. cellSens Standard – 기본 이미지 획득, 처리 및 측정
cellsens Standard는 시간간격 촬영(Time Lapse) 및 수동 몽타쥬 혹은 이미지 스티칭 (MIA) 과 같은 향상된 이미지 캡쳐 처리를 가능하게 합니다. 또한 명암 기반의 소프트웨어 오토포커스, TWAIN 입력장치로부터의 획득도 제공합니다. 이미지 주석, 처리 및 측정 도구들이 제공됩니다.
3. cellSens Entry – 기본 이미지 획득
cellSens Entry 는 현미경으로 디지털 이미지 획득 및 문서화를 원하는 연구자들의 이상적인 초석이 될 것입니다. 올림푸스 cellSens Entry는 쉬운 설치 및 모든 올림푸스 카메라로부터 이미지 획득이 가능합니다.
4. cellSens Viewer – 무료 이미지 뷰어
무료의 cellSens Viewer 소프트웨어를 사용하여 여러분의 동료와 함께 하십시오. cellSens Viewer 소프트웨어를 다운 받은 누구라도 어떠한 cellSens 제품으로부터의 획득, 측정, 주석이 포함된 이미지를 보실 수 있습니다.
Process Manager는 현미경, 셔터, 필터 휠 및 Z축 장치들의 복잡한 획득 작업을 빠르게 해줍니다. 어떠한 조합의 다채널(multi-wavelength), Z-stack 및 시간간격(Time lapse)실험도 가능 합니다. 형광 Unmixing 및 colocalization 분석 도구로 여러분의 다채널(multi-wavelength) 영상에서 최대의 정보를 얻으십시오.
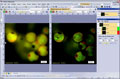
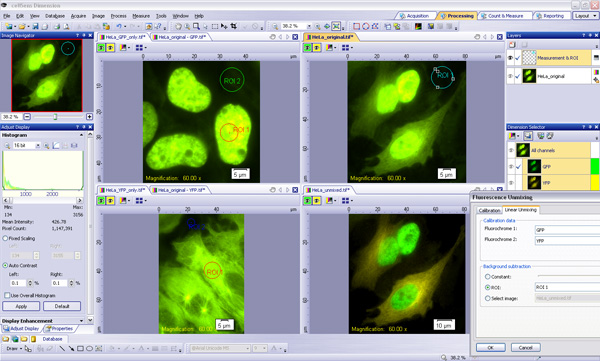
선형 Unmixing 기능의 GFP 및 YFP Unmix
2. 다중 위치 획득 (Multi-position Acquisition)
XY 모터 스테이지 제어로 이미지 획득 능력을 확장 하십시오. 다중 위치 획득은 붙여진 파노라마 이미지들의 빠른 생성을 위한 자동화된 다중 이미지 정렬을 제공합니다. 단 한번의 클릭으로 전체 스테이지 영역 혹은 다중 스테이지 위치들을 방문함으로써 기구들의 작업량 및 효율을 개선 하십시오.
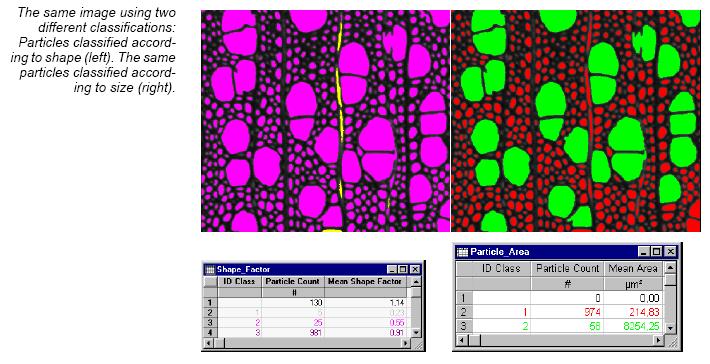
3. Count & Measure Advanced
임계값 기반의 효율적이고 정밀한 개체들의 검출 및 분류, 데이터 내의 분리된 그룹들의 명확하고 효율적인 다중 요소 개체 분류를 수행 하십시오. 이 모듈은 중첩 교정된 영상의 격리된 Emission 신호 이미지의 spectral unmixing에도 적용 가능합니다.
Count & Measure Advanced 모듈은 개채 식별, 측정 및 개채 분류에 대한 완벽한 도구들을 가집니다.
4. CI Deconvolution
Constrained iterative (CI) deconvolution을 이용하여 믿을 수 없는 속도로 이미지 해상도, 선예도 및 명암을 개선 하십시오. 이 솔루션은 극강의 품질 및 deconvolution 알고리듬의 효율성을 제공합니다. 생성된 여러분의 고품질 이미지로 Voxel-Viewer 기능을 통한 진보된 3D 시각화로 탐험할 수 있습니다.
CI Deconvolution 모듈은 최신의 알고리듬과 업계 최고의 속도를 제공합니다.
5. Database
만약 대량의 이미지와 데이터를 생성한다면, 여러분의 콜렉션에서 효율적인 관리 및 검색은 핵심적인 기능 입니다. cellSens Dimsension을 위한 Database 모듈은 Microsoft SQL Server Express 2005를 사용한 클라이언트-서버 데이터베이스를 추가하여 이미지들과 관련 데이터 및 메타 데이터가 명확하게 관리할 수 있도록 합니다.
castIron is the software specially designed to analyze gray iron. It measures the shape and size of graphite, as well as the ratio of ferrite to perlite. Both of these measurements meet the requirements of well established national and international standards like EN-ISO and ASTM.
All functions support either automatic or manual operation. The implementation of individual company standards is supported.
Analysis of cast iron according to standards
castIron uses modern image-analytical multiclassification algorithms. Each graphite particle is automatically recognized and classified with regard to its shape and size. Results are presented either according to · ASTM A 247 · JIS G 5502 · EN ISO 945 or · GB 9441-88.
Switching on the detailed analysis option enables the calculation of additional size and shape factor distributions. These are outputted in sheet and diagram format.
The ferrite and perlite fraction is calculated with the graphite content taken into account. The automatically generated result sheets and diagrams can be outputted in different formats.
All settings of castIron are saved to profiles and therefore easily adaptable to different preparation techniques or report requirements.
castIron is completely integrated into the analySIS®image analytical software. This integration ensures that the whole evaluatory process – from image acquisition to the completed report – is fully automated.
castIronautomatically sets thresholds and therefore detects graphite particles immediately. The graphite particles can be classified according to predefined standards. A detailed shape class statistic is included to achieve highly precise and reliable reults. To rule out any statistical or specimen-related error, castIron supports the fast and efficient evaluation of a great number of images for one analysis.
Ferrite to perlite ratio measurements are corrected for the graphite sample. Corrections can be made using either a manually inputted constant graphite value or the result of a preceeding graphite measurement.
castIron can operate fully automatic when using the analySIS® AutoMater. A simple push of the button, and all images are acquired, evaluated and the report is generated.
Specifications
automatic evaluation of cast iron with regard to size and shape of the graphite
all common norms supported (ASTM A 247, JIS G 5502, EN ISO 945, GB 9441-88)
integration of individual industry and company norms
detailed shape and size class statistics
determination of ferrite and perlite proportions regarding graphite content
graphite content immediately updated via most recently conducted measurement – at the push of a button
automatic generation of norm-adapted report
all settings saveable
entire evaluatory process is fully automated
integrated in analySIS® 3.0 and higher
Layer Thickness
analySIS Five imager 이상의 제품에 Module을 추가 할 수 있습니다.
Surface coatings protect materials from corrosion and wear. Specially applied coatings provide materials with new properties.
These might be decorative coatings or insulatory and anti-corrosion coatings as well. Other kinds of coatings alter hardness locally.
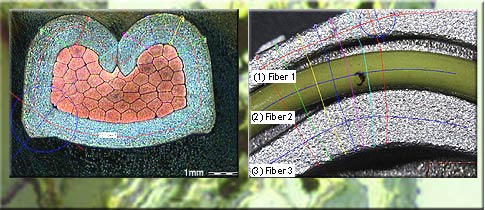
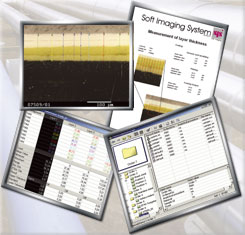
Soft Imaging System offers a series of solutions for determining the various thickness parameters. The analySIS® add-in ltm (layer thickness measurement) offers efficient coating-thickness measurement and crack analysis.
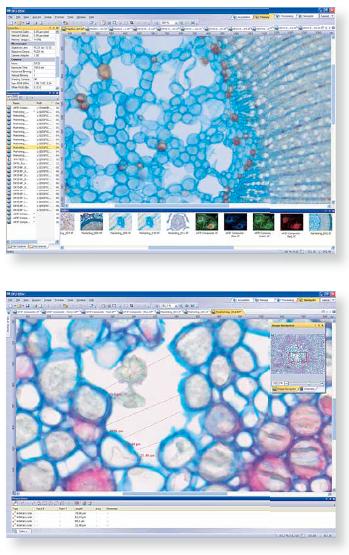
The concept ltm is mainly a tool for manually determining layer thickness for analyzing porous or compact coatings but also provides highly precise measurement of crack widths. The add-in supports any layer geometry with no restrictions to straight lines. ltm measures layer thickness(-es) of single and multiple coatings of a cut specimen using the concept of neutral fibers which predefine the direction of the measurement.
Measurement options and data handling
When measuring, ltm is capable of following the contours of arbitrarily shaped surfaces. The software tracks the crack or the shape of the contour of the coating and provides the calculated data results immediately. Several measurement features such as layer-thickness values for each layer, average values, minimum and maximum values or standard deviation and a tolerance control are available.
Fully integrated
The full integration of ltm into the analySIS® software provides all the capabilities and advantages to successfully face the challenges of image processing and analysis. All relevant images, evaluation sheets and diagrams can be stored in the structured archiving system with one mouse click following layer thickness measurement. Using drag&drop functionality for images, sheets, diagrams and database content, the report generator lets you create professional reports from the archived data within seconds.
Specifications
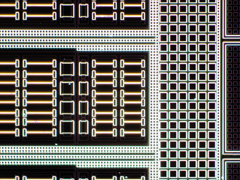
Convenient tool for measuring layer thicknesses in cross sections Supports any layer geometry and orientation Supports multiple layers – coherent or not coherent Concept of neutral fibers for high precision measurements Multitude of neutral fiber definable Result sheet includes statistics Support of tolerances for every single layer (“OK- Not OK” evaluation (if tolerances are specified) Layer structures can be saved for later use including all parameters Fully integrated into analySIS® (image acquisition, image processing and analyzing, structured archiving, reporting)
BONUS Package란 무료로 제공되는 기능으로서 ChartNav, mht (microhardness testing), roughness를 지원합니다. 단, analySIS Five imager 이상의 제품만 지원합니다. (imager, docu, auto, pro등급만 지원)
chartNav specialized module for use in the metallography field
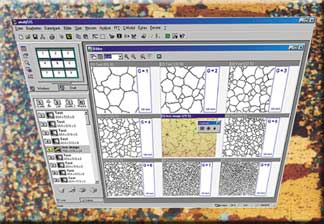
chartNav makes use of the analySIS® ViewPort Manager. This ViewPort Manager enables you to view several images simultaneously via multiple ViewPorts. This makes comparing a live image to reference images very easy – at a glance.
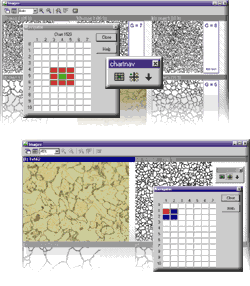
chartNav is operated via specific dialog boxes. A separate button bar allows you to switch back and forth between the 3×3 or 2×2 image configuration.
The alignment series required is selected from an extendable list. chartNav supports the creation of your own, and in principle, as-long-as-you-wish alignment series. Predefined norm series can be supplemented; user-defined alignment series created.
You can switch back and forth between a 2×2 or 3×3 image view. A green square represents live-image position (for the 3×3 view, this is in the center; for 2×2, at the upper-left). This square can be moved to the various lines and columns via mouse / keyboard. This is the way further images of the alignment series are displayed in ViewPorts. Lines and columns can be named as you like. You can also have the name of the norm series displayed.
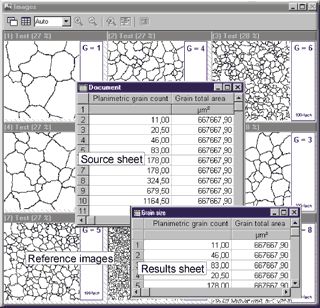
Moreover, you can have the name of the current alignment series displayed and edit the line and column names. Each alignment series can be extended with a user-definable data sheet. Its lines contain the specific data of the respective reference images. This data can be transferred to a results sheet during an alignment-series comparison and used for classification of the object within the live image. The statistic functions within analySIS® provide additional evaluation options.
Once you’ve found the appropriate reference image, you can transfer its data from a user-definable source sheet to a list of results at the click of a button. A statistical evaluation of this classification provides further information. Images acquired and result sheets can be saved and managed in theanalySIS® integrated database.
chartNav ensures rapid image acquisition, assignment of live image to reference image, and documentation of object properties.
We also offer chartnav extensions for the following standards:
chartNav extensions:
description
Digital Chart DIN 50601
Reference images of standard DIN 50601 for micrographic determination of the ferritic or austenitic grain size of steels and ferrous materials.
Digital Chart DIN 50602
Reference images of standard DIN 50602 for the microscopic examination of special steels using standard diagrams to assess the content of non-metallic inclusions.
Digital Chart DIN EN ISO 945
Reference images of standard DIN EN ISO 945 for the designation of microstructure of graphite inclusive.
Digital Chart ISO 643
Reference images of standard ISO 643 for the micrographic determination of the ferritic or austenitic grain size.
Digital chart ASTM E 112
Reference images of standard ASTM E 112 for the micrographic determination of the ferritic or austenitic grain size.
Specifications
excellent ergonomics through simultaneous image display alignment-series comparison with live or saved images easy to operate via the image matrix 3×3 or 2×2 image views easy to select image series unrestricted definition of own image series display of ID numbers easy classification via user-definable data sheets statistical and archiving functions integrated in analySIS® 3.0 and higher
mht(microhardness testing)
Analyzing microhardness indents quantitatively
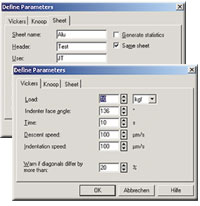
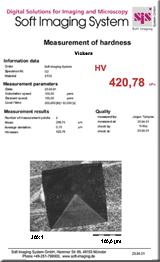
mht is the analySIS® module for determining microhardness according to Vickers and Knoop. mht supports ‘Reportlink’ so you can insert your measurement results into reportsfully automatically.
mht investigates the hardness indents using interactive measurement methods.
Results appear in a sheet which includes the measured and calculated values, including statistical evaluation.
mht supports determination of hardnesscurves. You define the starting line and direction interactively.
The calculated values are then displayed graphically. mht also provides you with the option of reading out your devicesetting.
· EN ISO 945 · ASTM A 247 · GB 9441-88 · …
Roughness Module
analySIS Five imager 이상의 제품에 기본적으로 사용이 가능한 Roughness 는 캡쳐된 화면의 정보를 이용하여 Roughness를 측정 합니다.
How to measure Roughness
Roughness along a line
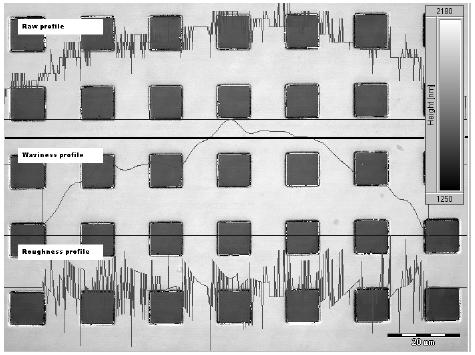
The results of a roughness measurement is given as a set of parameters and profiles, derived from a measurement of the surface of the specimen.
This measurement is performed along a line. The traditional method for this
Primary, Roughness, and Waviness 233 is leading a mechanical stylus across the surface of the specimen and tracking the height variation. The actual parameters and profiles are extracted and calculated from this measurement. With the roughness module you interactively perform the measurement on an image calibrated so that the image intensity corresponds to a height value. A “no dimension” approach is also supported. In case a dimension is required, the given parameters is noted as “NA”.
Roughness along a
polyline
Using the Roughness module in 1D, you may also measure the roughness along a polyline instead along a simple, straight line. The calculations used for determining the profiles are designed to correctly handle measurements along straight lines, though. This means that the roughness and waviness near the vertices of the polyline have to be used with caution.
Roughness in a rectangular
area
The traditional approach of leading a mechanical stylus along a line across the surface, does not allow extending the method to two-dimensional measurements.
Therefore, all roughness parameters are calculated rather than measured. For an explanation and the formulas used, refer to the chapter Measuring 2D Roughness.
An example for three profiles for a Row displayed. the thick, black line is the one selected for the analysis.
The parts with a value of 0 in the waviness and roughness profiles are due to the setting of λc
“analySIS“제품은 세계적으로 유명한 독일의 영상분석 전문업체인 OLYMPUS Soft Imaging System(OSIS) 사에서 제작한 최첨단 영상분석 프로그램입니다.
OLYMPUS Soft Imaging System사는 1987년 설립된 후 2006년 4월 OLYMPUS의 일원이 되었고 광학 현미경 및 전자 현미경용 분석 소프트웨어 및 디지털 카메라 제품을 포함한 영상분석의 모든 솔루션 제공하고 있으며 유럽을 중심으로 다양한 분야에 사용되어 전세계의 많은 영상 분석 전문가와 연구진에게 사랑과 신뢰를 받고 있습니다.
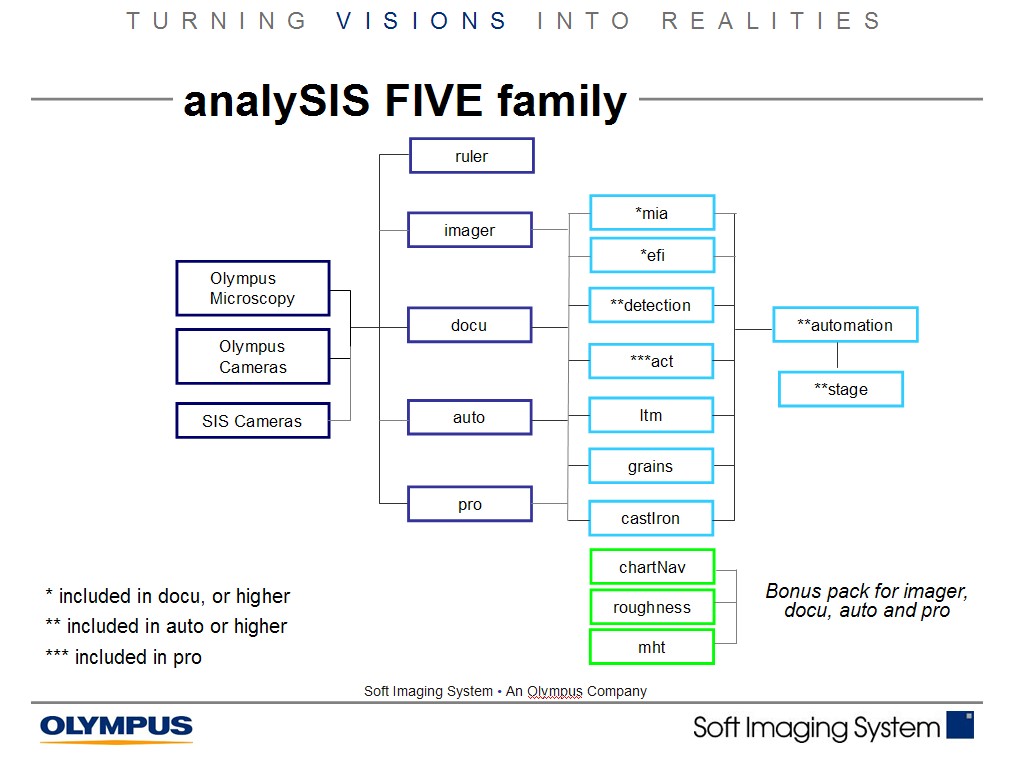
주로 금속, 반도체, 전기, 전자, 자동차과 같은 정밀한 측정을 필요로 하는 산업용 image analyzer인 analySIS five는 다음과 같은 등급으로 구성되어 있고, analySIS five imager 이상의 등급부터 필요한 module을 추가하거나 제품을 upgrade할 수 있습니다.
ruler : analySIS five의 가장 처음 등급이지만 강력한 측정 기능을 제공합니다.
imager : analySIS five의 두번째 등급으로서 ruler의 모든 기능과 data base, report 기능이 추가 되었습니다. 또한 imager 이상의 등급부터 필요한 module을 추가하거나 제품을 upgrade할 수 있습니다.
docu : analySIS five의 세번쩨 등급으로서 imger의 모든 기능과 Multiple Image Alignment (Mia), Extended Focal Imaging (efi), Graph 기능을 제공합니다.
auto : analySIS five의 네번째 등급으로서 docu의 모든 기능과 Particle analysis(detection:입도분석), Automater / Stage control의 기능을 제공합니다.
pro : analySIS five의 최고 등급으로서 auto의 모든 기능과 fft (fast fourier transformation), imaging C, act (automatic caliper tool), interCept 등의 기능을 제공합니다.
OLYMPUS Soft Imaging System 사의 최신 영상 분석 프로그램인 “analySIS Five” 시리즈는 사용자에게 정확하고 신뢰성 있는 데이터를 얻게 해 줄 것 입니다.
analySIS Five ruler
analySIS Five ruler는 analySIS Five Series의 기초 프로그램으로서, 사용자가 불필요한 기능을 삭제하여, 간단하게 측정을 할 수 있는 프로그램입니다.
Acquisition
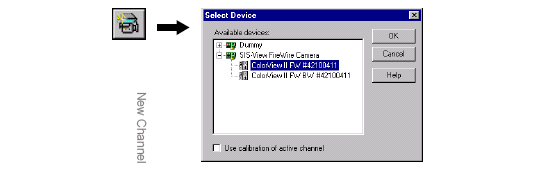
여러 종류의 카메라를 연결 상황에 맞게 카메라를 연결하여 사용할 수 있습니다.
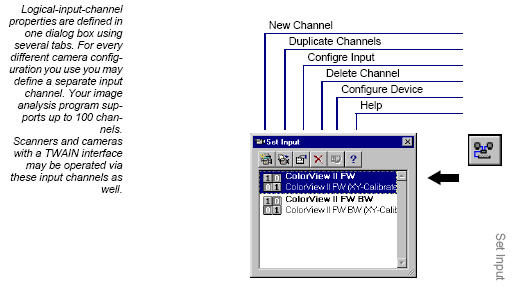
New Channel
카메라에 채널을 두어 화면 캡쳐시 다수의 카메라 속성을 두어 측정 할 수 있습니다.
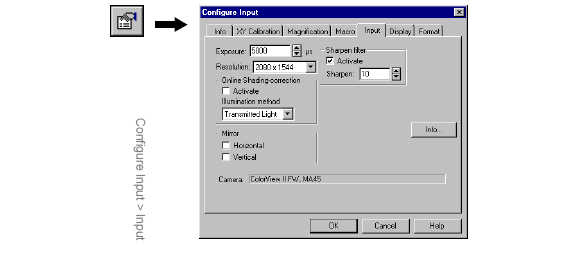
Configure Input
카메라의 속성을 변경합니다.
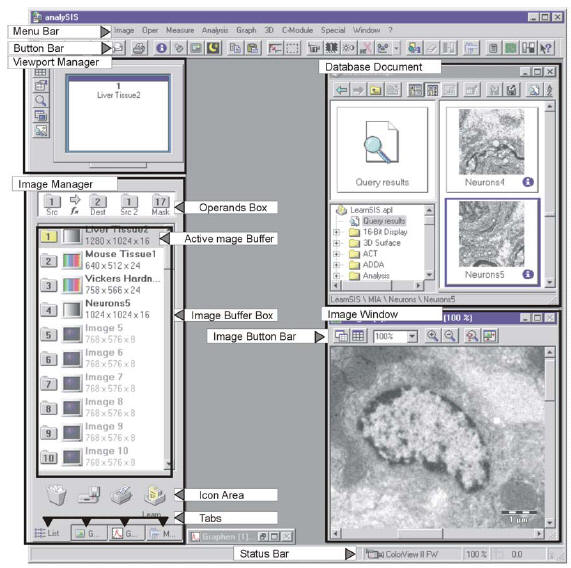
User Interface
전문가를 위한 인터페이스 방식으로 한눈에 알 수 있는 구조입니다
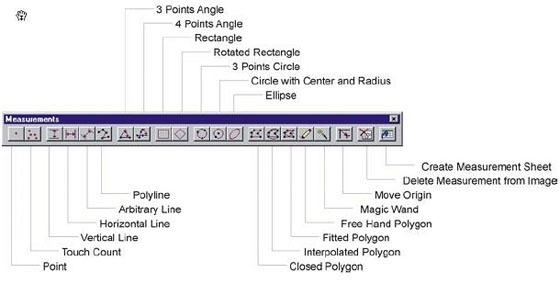
Measure
강력한 Magic Wand 기능을 자랑합니다.
analySIS Five imager
analySIS Five imager는 analySIS Five Series중 analySIS Fiver ruler을 기본으로 몇 가지 기능을 추가한 프로그램입니다. analySIS Five ruler가 꼭 필요한 기본 기능이라면, analySIS Five imager는 레포트 작성기능과 DataBase등의 부가 기능을 지원합니다.
DataBase
기능
defining or editing fields deleting the database defining a database password changing image and document paths changing the standard image format
Data types
Text: letters and numbers up to a maximum of 255 characters. Long: whole numbers, e.g., -10, 0 or 500. Double: whole numbers and fractions, e.g., 1.2 (whether a comma or a period is used for decimal fractions depends on the local settings of your operating system). Date/Time: The permitted date and time formats depend on the local settings of your operating system. Memo: any length texts Yes/No: For fields of this data type there is either the status
Report Generator
기능
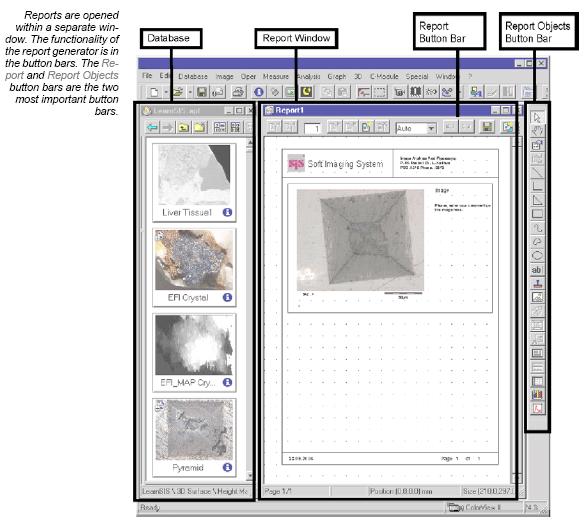
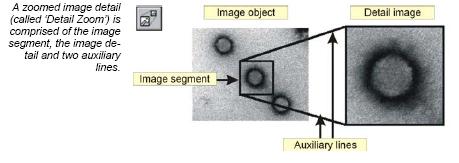
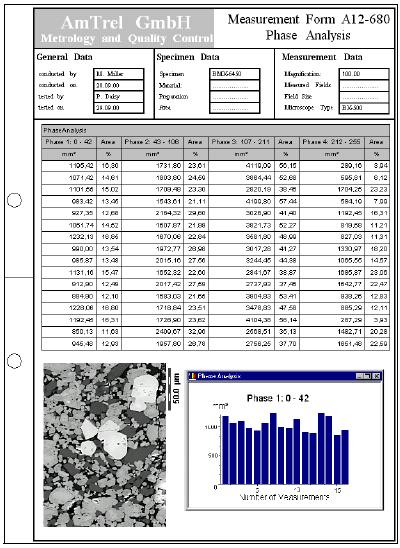
Use report generator to have multi-page reports produced practically automatically, including images of a database or of the image manager. Select a number of, (or lots of) images from an image database and have them all added to a report using a single command. Full database-integrated access Along with the images themselves that you get out of a database, you can have all additional information on the images (contained in database fields of image databases) automatically included in a report. Sheets with important measurement results can also be automatically filled in. Working with images A particular focus of report generator is being able to work with images in an optimal way: norm enlargements are followed; detail zooms can be inserted; appropriate image segments can be selected; and more. Texts, Sheets, Diagrams, Graphs Most types of documents that you generate within your image analysis program can be inserted into a report. Via report generator, you can, e. g., print out images along with related measurement sheets and diagrams on the same page. Flexible Page Layouting Report generator provides you with the most flexible page layouting imaginable: you set up your own template pages exactly the way you want them to be. You generate your template pages only once. These templates are the basis for your reports and ensure that the appearance of your documents is uniform. MS Word compatible Via the RTF Export function, you can have reports exported to MS Word 1:1. This enables you to communicate with fellow colleagues who may not have access to your image analysis program.
예 1)
예 2)
예 3)
analySIS Five docu
analySIS Five docu는 analySIS Five Series중 analySIS Fiver imager를 기본으로 몇 가지 기능을 추가한 프로그램입니다. analySIS Five docu는 다음 분석이 가능합니다.
Dual Screen System
두 개의 모니터를 사용하여 넓은 화면으로 이미지의 분석 효율이 높아집니다.
Graph
그래프 기능으로 레포트에 충실한 자료로 당신의 레포트 질을 높일 수 있습니다.
fis (Fast Image Acquisition)
고속으로 이미지를 획득하여 빠른 변화를 손쉽게 저장할 수 있습니다.
Stage Navigator
Stage Navigator를 이용하여 원하고자 하는 포인트를 지정하여 빠르고, 정확하게 확인 하실 수 있습니다.
With the Stage Navigator you can acquire overview images of a sample and use them for a precise navigation. This assures that you always know your exact location on the sample. You can recognize interesting areas in the sample, move to them in the live-image, and acquire images with a higher magnification. In the overview image, a “grid within a grid,” enables you to recognize the areas you have acquired with a higher magnification. You can deactivate this display if you want to.
MIA (multiple image alignment)
여러장의 사진을 합성하여 넓은 영역을 하나의 파일로 만들어 편리한 관찰이 가능합니다.
Mia works with both monochrome and color images, supports the entire number of file formats in analySIS®, and includes an intelligent image acquisition mode with automatic calibration of the camera and camera and/or image rotation.
Once this has been defined, all you need to do is to make a decision about the required image size and resolution. Stage movement, image acquisition and the computation of the optimum overlap are done automatically by the software.
To effect the image montage, the individual images have to be aligned with sub-pixel accuracy. Mia achieves this through intelligent pattern recognition techniques and plausibility checks within the overlap areas.
The resulting image has the same resolution as the individual images but is larger. It has more lines and columns. It thus represents an image that could not be acquired without Mia with high resolution and large field of view.
How does Mia work?
1. The integrated image acquisition control allows the automatic acquisition of individual images; image rotation and stage displacement are automatically determined.
2. This example uses six individual images for the Mia process. There are no limits to the number of images Mia can process in one session. The number of images you actually use is dependent only on the storage capacity of your computer
3. After image acquisition, you can manually determine the number, pattern and correlation of the individual images. In the case of automatic image acquisition, these parameters will be preset for you.
4. After Mia has processed the images, the overlap areas can be adjusted automatically for differences in intensity.
The result of the Mia process:
The end result (reduced to 0.7% of its actual area)
Image size: 2159 x 1062 pixels in 24-bit true color.
Nine image sections, each 1024 x 1024 pixels in size, automatically stiched together by the module Mia.
The high resolution 3300 x 3300 pixel sized full view image shows healthy and degenerated nerve cells.
EFI (extended focal imaging)
Focal depth 가 다른 이미지를 하나의 이미지로 합성하여 또렷한 이미지를 얻을 수 있습니다.
Microscopy at unlimited depth of focus
By using the efi module, you can solve a known and limiting problem of light microscopy: Microscopes in general have only a very limited depth of focus. Details which are visible in separate images with different focus settings are normally not visible in one single image.
efi records images with different focus settings and extracts those parts of the image that are in focus. Mounted into a single image, these details combine to create an image with unlimited depth of focus.
efi supports the automatic montaging of both color and b/w image series. Optionally, you can reconstruct a height map from these images. Used in live mode, efi provides both a live image as well as the partially reconstructed image. Missing details can be focused interactively and added to the current image.
efi automatically aligns images that show a lateral displacement, such as if the images were taken with a stereo microscope. Anoptional motor stage control provides the added advantage of automatic image acquisition and efi processing.
Live-image and Real-time calculated recombination of image
Reconstructed image
efi circumvents the physical limitations of a microscope regarding its depth of focus. A number of images are recorded, each one with a different focus setting. The parts of each image that are in focus are extracted and combined into a single, focused image.
efi allows the combination of images with lateral displacements caused by different focus settings. This is a common effect when using a stereo microscope to capture the images. Before calculating the efi image, an integrated pre-alignment step shifts the images so that they overlap perfectly. Only after this alignment has been achieved does efi calculate the final image.
efi image surface reconstruction combined with the heightmap
efi provides the option of calculating a height map from individual images. This height map can be used to produce a 3-D representation of the object. As an optional feature, the efi image can be used to texture the height map, creating a realistic topographic representation of the object’s surface.
A number of powerful functions for animating the 3-D structure within analySIS® enable the user to study the object from an optimal angle and position.
Live-image and Real-time calculated recombination of image
Reconstructed image
Recombination of a focus series of a metallurgical sample. The recombined efi image is necessary for conducting advanced analysis.
efi allows the concurrent visualization of the live image directly from the microscope and the current recombined image. Areas that are still unfocused can be added interactively.
A simple addition of more images, even if the original acquisition was finished, allows adding further focused details to the image.
Live-image and Real-time calculated recombination of image
Reconstructed image
analySIS Five auto
analySIS Five auto는 analySIS Five Series중 analySIS Fiver docu를 기본으로 몇 가지 기능을 추가한 프로그램입니다. analySIS Five auto는 강력한 Detection기능을 제공하여 다음 분석에 적합 합니다.
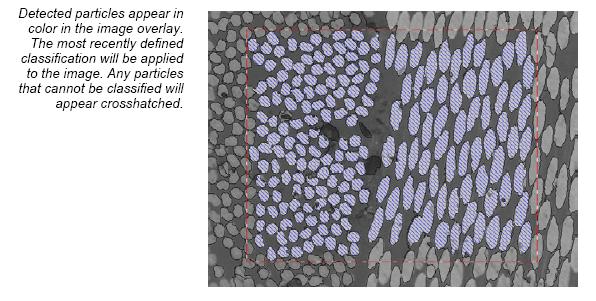
Detection
이미지에서 원하는 영역을 설정하여 자동으로 개체 분석을 합니다.
Detection can be applied to an entire image or restricted to areas with a frame or within ROIs. How border particles are treated is something users can decide themselves. The particles detected can then be evaluated according to an extensive array of parameters and then be automatically classified. Logical connection of particle parameters is also supported.
automater / stage
Stage controller 를 이용하여 사용에 편리함을 더합니다.
Our stage drivers support stages from the following manufacturers:
· A+S
· Applied Scientific Instrumentation (ASI)
· Deben
· Fjeld
· Galei
· ITK
· LEO TEM stages
· Linkam
· Ludl
· Märzhäuser
· Micos
· Objective Imaging Ltd.
· Olympus AX70 stage
· Philips CM and XL stages
· PRIOR
· SESAME
· Thermo Nicolet
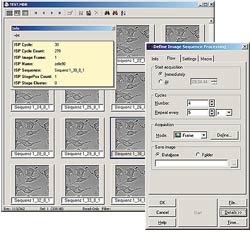
isp (Image Sequence Processing)
Controlling position, sequence and time interval …
In recent years, the investigation, documentation and analysis of living tissue and /or dynamic processes has emerged as an issue of primary importance. One of the core applications, eg, is the investigation of GFP-labeled cells (Green Fluorescence Protein). Multiple labeling of the cells is possible via mutations of the GFP. Light microscopy exploits these technologies using time-lapse and multichannel fluorescence microscopy.
In order for you to be able to acquire and process automatically, a number of processing functions with regard to the microscope are necessary: autofocus; automatic adjustment of the image frame in live observation of GFP-labeled cells (tracking); acquisition of images at different focus positions (z-stacks); and the automatic calculation of an extended focus image based on the z-stacks.
The isp add-in was developed with these requirements in mind. isp controls the entire acquisition process including hardware components such as microscope, cameras and motorized stages. The isp add-in guarantees the exact definition and execution of image acquisition in terms of timing and positioning.
isp and time-lapse image acquisition isp provides the necessary functionality for time-lapse acquisition. Both the number of images, as well as their temporal sequence can be defined. Each sequence can use different cameras or input channel definitions.
isp and a motor stage
If a supported motorized stage is available isp can move to various positions and cycle through image-acquisition sequences. This feature can be used to define multiple positions on a sample where each sequence has its own acquisition parameters, camera settings and techniques, and to cyclically repeat the acquisition for each position according to a user-defined interval.
isp and motorized microscopes isp is completely integrated into the analySIS® software and can communicate with communication-enabled microscopes via a variety of interfaces. This allows isp to control illumination conditions, the filter and objective positions and so on, for each sequence.
isp and macros isp also includes sequential pre- and post-processing steps for controlling external devices such as shutters or monochromators.
isp and animation All image sequences can be stored in a database for later retrieval and analysis. isp includes an animation studio for processing and displaying these sequences. The acquisition times are displayed in the overlay. It is also possible to look at the same sequence in multiple viewports, or to run multiple sequences simultaneously. Sequences can, of course be exported as AVI files.
isp and fluorescence microscopy isp and the mFip analySIS® add-in are fully integrated. This provides options for acquiring and processing sequences that enable you, eg, to combine fluorescence and brightfield images.
isp and process control
isp includes an automatic process control tool. The times necessary for acquisition and processing are shown in a special dialog box which also includes a “test” button for checking and calculating the time required for the sequence. To avoid problems with memory usage during long, unattended processes, isp can estimate the total required space and will give you a warning message should it exceed the space available.
isp complex It is of course possible to combine individual processes and sequences and to set up complex, automated processes ranging from time-lapse and motor-stage-controlled image series and including fluorescence and microscope control.
isp and analySIS® Due to its complete integration into the analySIS® software, the user not only has access to all automatic and manual measurement functions and all image processing features, but also to all add-ins supported by analySIS®. Via the integrated image database, the images (including all available information on imaging conditions) are tracked. A report generator provides everything for preparing professional presentations, which can be e-mailed directly from analySIS® to colleagues or publishers of scientific publications.
wellNav (Well Navigator) Convenient and flexible
The WellNav application supports the simple and fully automatic scan of standardized microtiter plates Integrated calibration routines for offset and slant correction of the microtiter plates together with the integrated motorized stage control guarantee exact alignment and positioning. The software includes an Experiment Manager to easily define complex work processes. These are established just once and then executed via the push of a button. Process series include complete microtiter plates, single wells or even clusters of wells.
analySIS Five pro
analySIS Five pro는 analySIS Five Series중 가장 강력한 기능을 제공하며 다음 분석에 적합합니다.
ACT (Automatic Calliper Tool)
ACT performs complex, repeatedly applied measurement sequences automatically as well as measurements made within images.Any displacement of measurement objects within an image is automatically taken into consideration during measurement.ACT detects edges within images and calculates coordinates, intercept points, angles, radii and distances based on these edges.The geometric elements determined in this way can be linked via further measurement rules.In the learn mode, measurement sequences of varying complexity can thus be defined and saved as profiles.
InterCept
InterCept conducts quantitative image analyses according to the intercept method.Detection of intercept points includes support of edge algorithms as well as segmentation.Multi-phase evaluation is supported. Entire images or user-defined image segments can be analyzed. A large variety of line patterns are available.InterCept offers integrated preview functions for intercept length and related histograms.Results may be classified according to intercept length, distance to reference points and lines.Evaluation and classification can be done using original measurement data or modeled data or done using, for example, the Saltykov method (‘slice model’) or g value.
TrackIT!
TrackIT! analyzes motion.Motion analysis is based on time-lapse series of images (image stacks or exported isp sequences).TrackIT! searches for and detects objects within images of a time-lapse series and then automatically determines the respective difference in location.The software provides motion images of particles, sheets and histograms showing the characteristic motion data such as speed, directional information, track length and distance.In addition, all positions – P (x, y, t) – of each object in motion are available for further analysis.
Imaging C
Imaging C provides users with the C programming language and high-performance image-processing libraries containing more than 8000 commands.Windows API commands and commands from external DLLs are supported.This software extension includes a compiler and a debugger. Programs created using imaging C can be run in analySIS®.
OLYMPUS Soft Imaging Soluitons사는 1987년 설립된 후 2006년 4월 OLYMPUS의 일원이 되어 광학 현미경 및 전자 현미경용 분석 소프트웨어 및 디지털 카메라 제품을 포함한 영상분석의 모든 솔루션 제공하고 있으며 유럽을 중심으로 다양한 분야에 사용되어 전세계의 많은 영상 분석 전문가와 연구진에게 사랑과 신뢰를 받고 있습니다.
analySIS 제품의 경우 고 품질 고 성능의 영상 분석 소프트웨어임에도 비싼 가격으로 인하여 일부의 유저들만이 anlaySIS 제품의 우수성을 접할 수 밖에 없었던 것이 그 동안의 현실이었습니다.
이러한 이유로 기존의 analySIS 제품과 완벽하게 동일한 기능을 갖추면서 한국 시장의 특수성에 대응할 수 있도록 analySIS TS 시리즈를 새롭게 선보이게 되었습니다
금속, 반도체, 전기, 전자, 자동차 같은 정밀한 측정을필요로 하는 분야에 대해서 analySIS TS는 최상의 솔루션이 될 것입니다.
analySIS TS 시리즈는 다음과 같은 제품으로 분류됩니다.
1. analySIS TS Lite
analySIS TS의 Entry 급 영상 분석 소프트웨어 입니다.
강력한 측정 툴과 DataBase 관리 및 무한 초점 보정 (EFI) 및 이미지 타일링 기능 (MIA), 상분율 (Phase analysis) 등의 강력한 기능을 제공합니다.
2. analySIS TS Auto
analySIS TS의 중급 제품으로서 analySIS TS Lite 의 모든 기능에 강력한 자동 입자 분석 기능인 Detection 모듈 이 추가 되었습니다.
analySIS 의 강력한 입자 분석 기능은 80~100여 가지의 측정 항목에 대한 어떠한 분류도 가능케 하여 원하는 데이터를 효과적이면서도 강력하게 분석할 수 있게 합니다.
3. analySIS TS Material
analySIS TS의 최상급 제품으로서 analySIS TS Auto의 모든 기능에 금속 조직 분석을 위한 그레인 분석 (Grain size analySIS), 구상화 주철 분석 (cast Iron), Thickness 분석 (Layer Thickness Measurement) 및 Dendrite arm spacing 분석(DAS) 이 가능한 최상의 금속 조직용 분석 소프트웨어 입니다.
OLYMPUS Soft Imaging System 사가 한국 사용자들을 위하여 선보이는 “analySIS TS” 시리즈는 지금껏 경험 해 보지 못한 새로운 영상 분석에 대한 표준을 제시하여 줄 것 입니다.
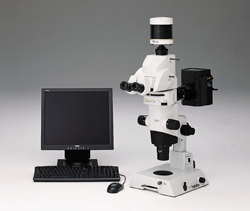
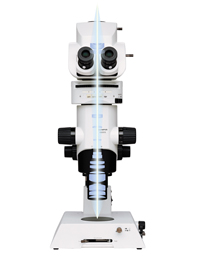
제품 소개 C-elegans, Zebrafish, drosophila, embryo, mouse 등의 형광 실험을 저 배율에서 수행하는 고객에게 최적화 된 장비입니다.
재생산, 개발 용도
gene, protein 등의 기능 분석
MVX10 : 제품명
M : (Macro)
V : (View)
X : (Olympus Optics)
10 : (Zoom ratio)
제품 특징
가장 밝은 Fluorescence Macro Microscope
고품질의 이미지에 중점을 두어 개발된 제품
시료의 물리적 조작이 주업무일 때 = SZX series –Injection 작업을 위한 스테레오 이미지가 중점이 됨
물리적 조작 보다는 이미지 품질 및 시그널 검출이 중요할 때 = MVX10 –형광의 밝기와 해상력이 주요 강점
Spec.: MVX-ZB10
Zoom body
– Type: single zoom”@”iZoom ratio:10) – Zoom magnification: 0.63x – 6.3x –Max. NA(1x Ob): 0.25 (Stereo: 0.125) – AS: Built in – Body mount: Dovetail (same as SZX) – Tube mount: Dovetail same as BX – Objective mount: M65 x 1.5 mm thread – Nosepiece: Screw method (same as SZX) – Body length: 211mm – Zoom click stop: 0.63,0.8,1,1.25,1.6,2,2.5,3.2,4,5,6.3 (possible to release) – Magnification display: zoom magnification (differ from SZX12 and SZX9)
Spec.: MVX-TTRS
uTilting Trinocular head for MVX – Tilting and Trinocular design
» FN: 22 »BI angle: 0- 23 degree » Interpupillary distance: 51 – 76mm » Optical path: 2 position (BI/photo: 100/0 and 0/100) » 3D-effect is available by pupil separation mechanism » Erect Image
– Tube lens » Tube magnification: 1x (tube lens f= 180mm) » Tube mount: Dovetail same as BX » Restriction with regular Trinocular
– TV adaptors » TV adapter: MVX-TV1xC, ,MVX-TV 0.63xC ( exclusive use) » No compatibility with UIS2 adaptors
– Internal magnification changer MVX-CA2X » Detachable into MVX-TTRS
– Eyepiece: Use WHN series » Diopter scale adjustment: none (with the eyepiece)
Spec.: MVX-RFA
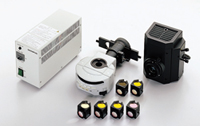
Coaxial fluorescence illuminator – Filter change: 4 position turret
3 mirror unit position + Blight field position Mirror units: XL type (See next page) – FS: Built-in, AS: none – Slider : open/2filter position
32ND filters pocket – Lamp house mount: Same as BX system Lamp house : 100W Mercury/75W Xenon – Tube mount: Dovetail same as BX
Excitation
Emission
Comment
U-MGFP/XL
460-490
510-
Exist product for GFP/Long path
U-MGFPA/XL
460-490
510-550
Exist product for GFP/Band path
U-MCFPHQ/XL
425-445
460-510
New product for CFP/Band path
U-MCFPHQ/XL
460-480
495-540
New product for GFP/Band path
U-MYFPHQ/XL
490-500
515-560
New product for YFP/Band path
U-MRFPHQ/XL
535-555
570-625
New product for DsRED/Band path
Spec.: Objective lens
Spec.: Objective lens
MVX exclusive PF (Per-focal) objectives
Per-focal length: 137mm Mount: M65 x 1.5 mm thread End part external diameter: 60mm (Same as SZX)”iwith out MVPLAPO2XC”j The MVPLAPO2XC equips with optical correction mechanism for live cell in the water Two place nosepiece available : MVX-2RE
 Features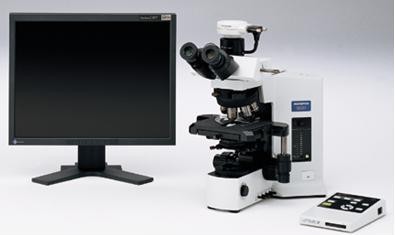





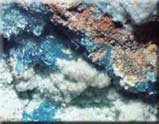
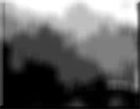
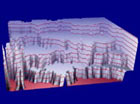

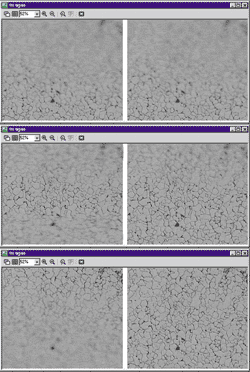



 Convenient tool for measuring layer thicknesses in cross sections