Image-Pro Plus Modules
Image-Pro Bundled Solutions
Image-Pro Bundled Solutions
* Image-Pro Advanced Microscopy Suite

This complete solution for high-level microscopy analysis and acquisition combines Image-Pro Plus 5.1 with powerful tools for multi-dimensional microscope control, image deconvolution, and 3D rendering (the same tools found in the Scope-Pro, AFA, SharpStack, and 3D Constructor Plug-in Modules).
*Image-Pro Multi-Dimensional Acquisition

Ideal for automated microscopy work, this package combinesImage-Pro Plus 5.1 with tools for multi-dimensional microscope control and acquisition (the same tools found in the Scope-Pro and AFA Plug-in Modules).
*Image-Pro Microscope Control

The Image-Pro Microscope Control (MC) package combines Image-Pro Plus Version 5.1 with tools to control and program the movement of your automated microscope and/or stage (the same tools found in the Scope-Pro Plug-in Module).
*Image-Pro 3D Suite

Ideal for deconvolution and interactive control and analysis of volume stacks, this package combines Image-Pro Plus 5.1 with image deconvolution and rendering tools (the same tools found in the SharpStack and 3D Constructor Plug-in Modules).
*Image-Pro Analyzer

Ideal for networked users who want advanced analysis tools but do not need image capture functionality at each work station. Image-Pro Analyzer offers all of the powerful analysis features of Image-Pro Plus 5.1, but does not include support for Twain or PhotoShop plug-ins. Available in 5 or 10-seat licenses.
Scope-Pro
Microscope and Stage Automation for Image-Pro Plus Software
Scope-Pro is designed to control and program the movement of automated microscopes and/or stages. It is available in the following Image-Pro packages: Image-Pro Advanced Microscopy Suite, Image-Pro Multi-dimensional Acquisiton and Image-Pro Microscope Control.
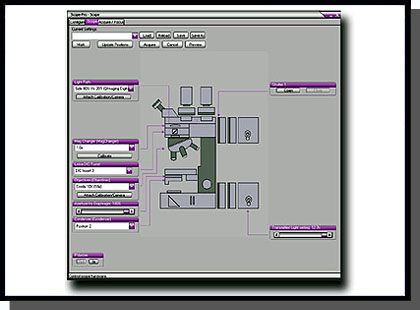
Standard point-and-click functions of the stage control include single step movement in any X, Y, or Z direction. Scope-Pro also controls your motorized filter wheels, shutters, filter sliders, and lamp settings.
Features
Easy Setup
• Control microscope hardware, including several
brands of filter wheels, shutters, stages, and automated
microscopes
• Use repeatable settings for all optical parameters
associated with image capture
• Define the scan origin at any point
• Improved spatial calibration procedures
• Streamlined and simplified user interface
• Support for multiwell plates and multiple microscope
slid holders
• Combine wells in a multiwell plate into experimental
groups
• Incorporate Image-Pro’s 200+ analysis and processing
routines
• Automate repetitive functions and movements by recording
them in an Auto-Pro macro or Visual Basic program*
Calibration
• Control devices with or without a calibration
• Preserve calibrations across lens changes with new lens files
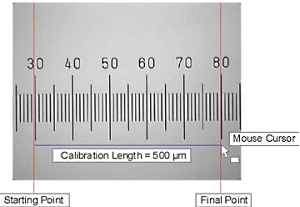
• Use stage movements to make calibrations

X, Y, and Z Control
• Define the acceptable range of travel
• Capture Z-stacks of images as a stack or sequence
• Generate and create Z-stacks, composite, and extended
depth of field of images for both brightfield and fluorescent
image data
• Measure X, Y, and/or Z distances
• Save X, Y, Z, and time information with the image
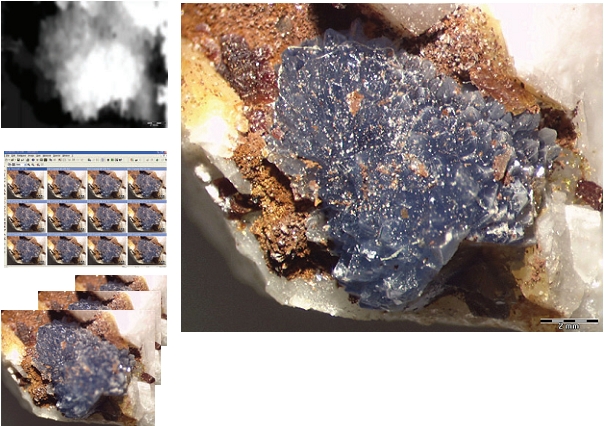
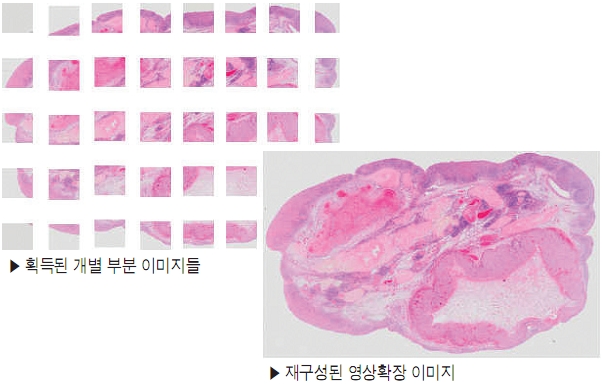
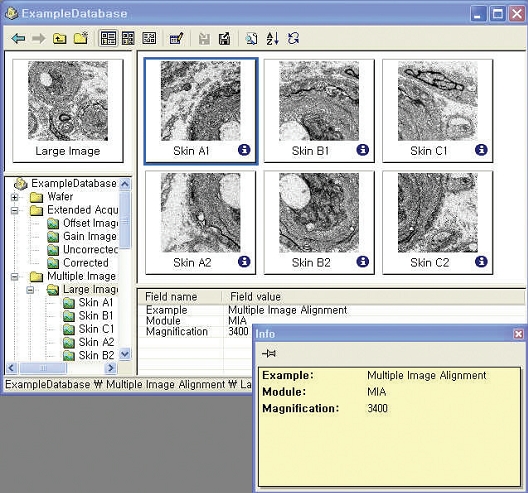
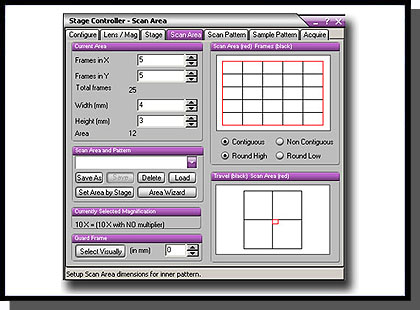
• Assemble tiled images into a single high-resolution image
Streamlined Image Capture
• Easily automate fluorescence and brightfield image
acquisition
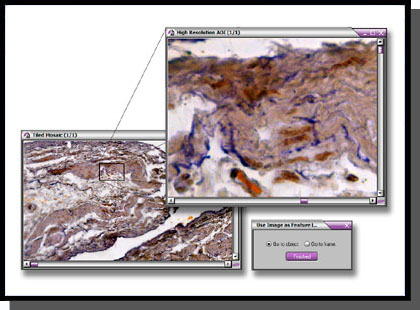
• Capture high-resolution images as a feature map
• Minimize light exposure and reduce photobleaching with
shutter control
• Prompt for non-automated peripheral components
* Macro programming tools only available for Image-Pro Plus users.
AFA
Advanced Fluorescence Acquisition-AFA
Automate and Manage Complex Acquisition Modes and Image Sets in Image-Pro Plus Software
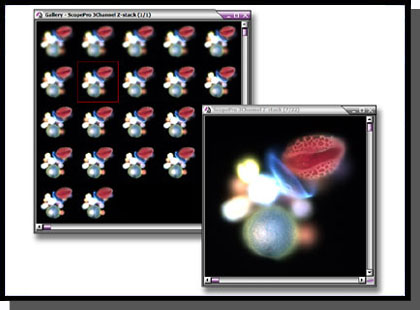
The AFA – Advanced Fluorescence Acquisition plug-in module is for designed research microscopists who need to automate and manage complex acquisition setup parameters, user feedback display, and subsequent sorting into sets for analysis. It allows researchers to manage all combinations of image acquisition modes and image sets including time, channel (wavelength), focus (z-stack) and stage position.
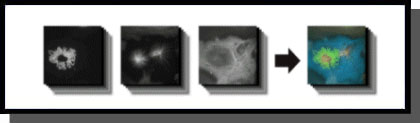
*Composite image courtesy of Richard Cole, Wadsworth Center, Albany, NY.
Features
Acquire and Manage Image Datasets in Multiple Dimensions
• Time – Perform time-lapse experiments or automatically calculate the fastest cycle time.
• Channel (wavelength) – Using Scope-Pro’s configuration files, images can be collected from individual
channels. While fluorescence wavelengths are the most common channel type, DIC, RGB, and other modes
can be defined. Descriptive input settings(e.g. Numerical Aperture, Refractive Index and ObjectiveMagnification)
are stored and can be read and used automatically by the SharpStack deconvolution and 3D Constructor Plug-
in Modules.
• Focus (Z-stack) – Return either a single best-focused frame or a full stack for deconvolution and rendering.
Focus drift can be automatically corrected by finding the best starting plane.
• Stage Position – Landmarks can be assigned and used for acquiring data from multiple locations. Alternatively,
a regular pattern(such as a 96-well plate) can be configured. Image-Pro’s tiling tool enables you to
automatically build large images from multiple, smaller location acquisitions.
Configuration Wizard
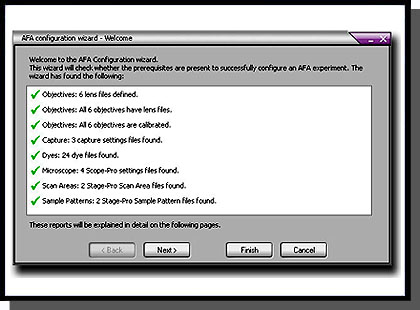
The Configuration Wizard guides you through the necessary setup procedures to ensure the success of your acquisition. AFA will automatically check to make sure it has the necessary settings to acquire your images, including objective lenses, spatial calibrations, camera settings, lookup table information, and Scope-Pro settings.
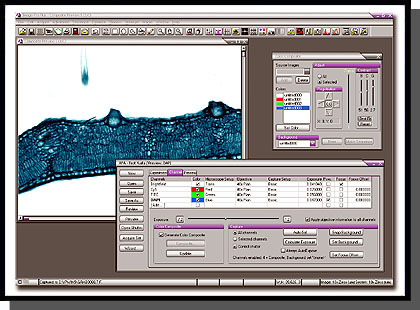
Exposure Control
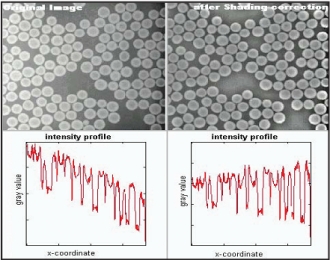
Full exposure control is available for each channel. You may even specify composite image to be automatically built as the image set is acquired. Convenient testing options ensure that no time is wasted in method development and an optimum image set is produced. For best results, background correction may be implemented.
Preview Settings
Multiple image sets can take a long time to collect. You do not want to discover at the end of a run that the parameters were not quite right. The preview function reassures that the desired settings are selected.
Status Update
Monitor the progress of your acquisition with the status display. View the total elapsed time, time left between
cycles, current sample position, wavelength, and Z-position. You may also pause your acquisition and re-focus at the current position. If you pause in the middle of a Z-stack, the partial Z-stack will be discarded and a new stack, centered on the new focus position will be acquired.
Manage Multiple Image Sets
Organizing, extracting, and displaying multiple image sets is a tremendous challenge. The elegant, simple interface of the Set Manager tool unlocks the information within your image sets. Use it to play a movie showing changes of any single dimension. The active data set can be extracted as a separate sequence and stored in .seq or .avi file formats that can be shared with other software for presentation and reporting. The Set Manager provides clear parameter display so you may understand how the data was collected (or assembled from separate sources) and documented. Set information may be stored and recalled via a database or via files.
SharpStack
SharpStack
Image Deconvolution and Image Deblurring Tools for Image-Pro Plus Software
SharpStack and SharpStack Plus remove haze and improve resolution in two-and three-dimensional image stacks using deconvolution and deblurring algorithms.
SharpStack offers Nearest Neighbor, No Neighbor, and Inverse Filter algorithm functions, while SharpStack Plus offers additional 2D and 3D Blind algorithms.
SharpStack and SharpStack Plus are available in the following Image-Pro bundled solutions: Image-Pro Advanced Microscopy Suite and Image-Pro 3D Suite.
Key Benefits
• Enhanced Visualization – Produce image with increased resolution, increased contrast, and improved signal-to-noise ratio.
• Work with Quantitative Data – Retain quantitative accuracy of your data with 2D and 3D blind algorithms.
• Smooth Workflow – The SharpStack Plug-in Modules integrate seamlessly with Image-Pro Plus, 3D Constructor and Image-Pro Discovery.
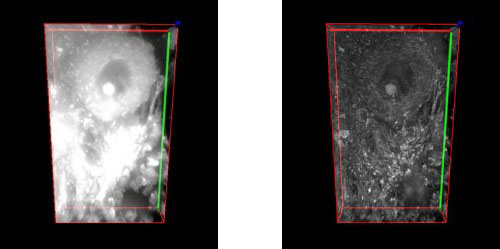
Image Deconvolution
Elucidating 3D Structures
Cells and tissues are three-dimensional structures, the observed image at the focal plane contains in-focus information from the plane of interest, as well as out-of-focus contributions from other parts of specimen.As a result, details within the image plane or volume of interest may be obscured. To reveal these structures and produce reliable 3D data, image sharpening techniques such as confocal microscopy and digital deconvolution and are widely employed.
Digital Deconvolution
Digital deconvolution is a mathematical method that restores haze from image planes in an optically sectioned image to its point of origin. The out-of-focus signal may be evaluated as a point-spread-function (PSF) which is applied to reverse the natural effects of blurring within an optical system. The beauty of the technique is that it does not omit or remove any signal being collected by the imaging system. Instead, each photon of light collected is evaluated and restored to its point of origin. The result is an image volume with improved clarity and contrast. The PSF is at the core of the deconvolution process. It determines how light is distorted in an optical system, taking into account such factors as the wavelength(s) of light being collected, the numerical aperture of the objective lens and the refractive index of the immersion media used to couple the microscope objective to the slide. The PSF models how a single point of light reacts to the imaging environment. As light distorts in its travels through the optical path, it assumes an hourglass shape. It is this effect which is then used to evaluate how light distorts at every point within the image volume. Here is how the process works- deconvolution algorithms make the assumption that the raw image volume is a convolution of the estimated volume with the PSF. These methods then make an estimation of what the raw image volume will look like when the PSF is applied to an estimation of how the haze-free volume would appear. The process is iterative, with several estimations being made, each one a closer approximation to the estimated volume. But since it is not possible to arrive at the original volume, constraints are placed on how many iterations the algorithms will make before returning the final deconvolved image. For this reason, the algorithms are referred to as constrained iterative deconvolution.
To simplify the process, the image volumes and PSF are converted into Fourier transforms, a simple method of modeling the data. By multiplying the Fourier transforms of volume and PSF, three dimensional coordinates are re-transformed into an image.


X/Y(left) and X/Y projection(right) of a single point of light blurred in an optical system. This information is used as a PSF to deconvolve images volumes.
Algorithms
Two general methods for haze restoration/removal are included in SharpStack and SharpStack Plus. Not only are deconvolution algorithms included, but also No- and Nearest-Neighbor haze removal (“deblurring”) methods.
Deblurring methods achieve resolution by subtracting light haze from image planes. The result is previously hidden details suddenly becoming apparent. Controls within SharpStack allow you to choose the appropriate level of haze to subtract.
The deconvolution routine used by SharpStack Plus makes use of the Maximum Likelihood Estimation algorithm. A blind PSF models the characteristics of the objective lens used to collect the image and creates a theoretical representation of blurring in the optical system. This blurring function is then used as the basis for restoring signal in the volume. The routine does not omit signal to improve resolution, providing sharp, clear and quantitatively accurate details of previously obscured structures.
Methods Included with SharpStack Plus:
• 3D Blind Deconvolution -Operates on the entire image volume. Photons are not removed so the image remains quantifiable. Uses the Maximum Likelihood Estimation algorithm to achieve resolution.
• 2D Blind Deconvolution -Operates in an iterative manner on a single image plane. This method has better noise suppression and resolution improvement compared to Neighbor-based methods. The 2D Blind method also retains the captured photons rather than removing them, yielding a quantifiable image.
• No Neighbors is a 2D deblurring method applied to a single image plane. Although this method is the fastest, it may not be as representative of the sample as the other methods.
• Nearest Neighbors is a 3D deblurring method which operates on limited Z information (3 slices). It operates by evaluating information from image slices that reside above and below the user-defined image plane of interest.
• Inverse Filter is a 3D deblurring algorithm applied to entire image volumes. It is a one-step, non-iterative approach based on the Wiener filter method. To achieve resolution with this technique, the captured image is divided by the analytic PSF. This method is a fast way to return a qualitative image. It will also return a better image than either the No- or Nearest Neighbor methods, especially along the X/Z and Y/Z axes. This filter can also incorporate a correction for spherical aberrations.
Methods Included with SharpStack and SharpStack Plus:
• No Neighbors
• Nearest Neighbors
• Inverse Filter
Spherical Aberration Correction:
SharpStack and SharpStack Plus contain a method for correcting spherical aberrations.
These effects may appear as haze in an image and result from irregularities in the optical system such as refractive index mismatches (i.e. using an oil immersion lens with a sample mounted in aqueous media) or incorrect coverslip thicknesses.
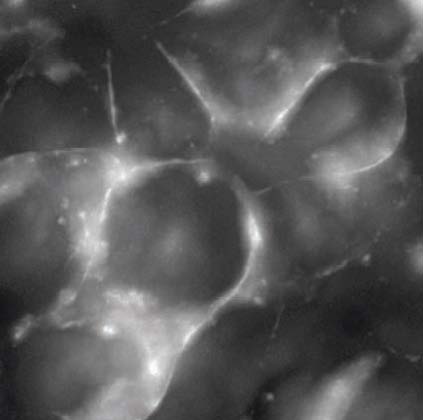
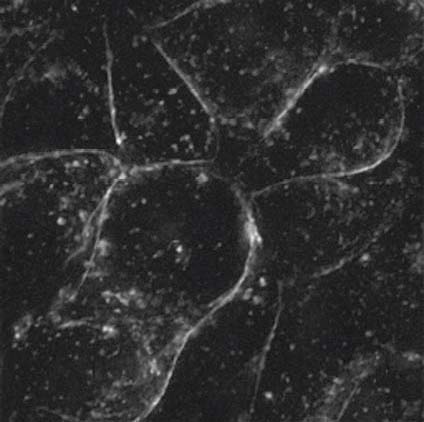
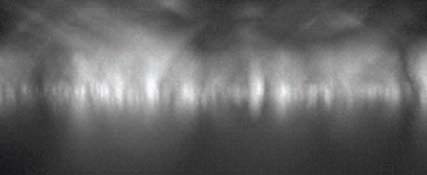
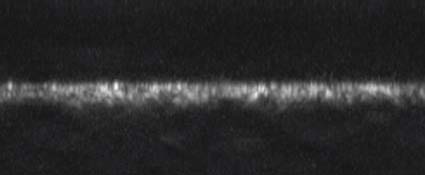
Figure 3: Example of spherically aberrated image: a) XY and b) XZ maximum intensity projection of the original image*, c) XY and d) XZ maximum intensity projection of the deconvolved image with spherical aberration compensation (algorithm provided by AutoQuant Imaging, Inc.).
*Courtesy of Diane Kube, Ph.D., Co-Director CF Imaging Core, CWRU Department of Pediatrics
3D Constructor
3D Rendering and Measurement Tools for Image-Pro Plus Software
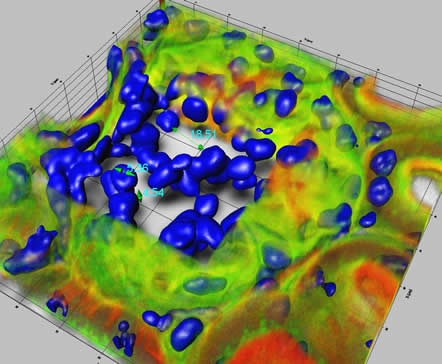
3D Constructor is for scientific researchers who wish to explore three-dimensional relationships within and among objects. It is available in the following Image-Pro packages:
Image-Pro Advanced Microscopy Suite and Image-Pro 3D Suite.
Overview
No other analytical imaging product for 3D rendering offers the power and functionality of Image-Pro’s 3D Constructor tool. Gain a better understanding of your images by visualizing, exploring, and applying measurements in three and four dimensions.
Images in Three Dimension
Explore the depth of your images by visualizing and interacting with them in three dimensions.
- View volumes from any angle, with adjustable transparency and shading.
- Zoom, rotate, and pan image stacks.
- Work with calibrated Voxel-size.
- Use adjustable lighting controls for enhanced viewing.
- Visualize clipping planes in orthogonal and oblique plane-selections.
- View internal features of 3D stacks by selecting volume of interest (VOI).
- Display synchronized, orthogonal views through an image stack with Stack Slicer.
- View multiple iso-surface renderings based on segmentation of selected intensities and colors.
- Project a virtual shadow of your image to get a better visual understanding of your object’s 3D shape.
Apply Measurements to 3D Images
Obtain quantifiable data from your three-dimensional image through manual and volume measurements.
Manual Measurements in 3D Constructor:
Obtain quantifiable data from your three-dimensional image through manual and volume measurements.
• Individual point.
• Point-to-Point distance.
• Point-to-Surface distance line.
• Line.
• Angle.
• Point-to-Line distance.
• Circumference of an object bisected by plane.
• Surface distance between two points.
Volume Measurements in 3D Constructor:
• Volume.
• Surface Area.
• Sphericity.
• Feret measurements.
• BOunding box measurements.
• Centroid information.
• Automatic update of measurements from frame-to-fram playback of 4D sequences.
• Set filter ranges for any measurements.
• Clean borders.
Track Objects in a 4D Sequence – NEW
Track and measure the movement of individual objects in a 4D sequence with the 4D tracking feature in 3D Constructor. Choose to automatically find 4D tracks in your image or manually track objects.
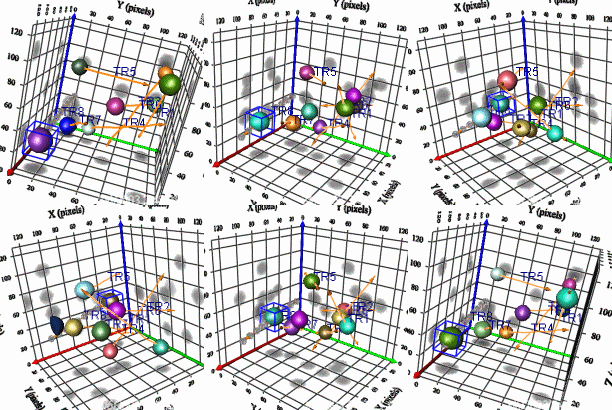
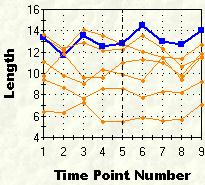
Example of 4D object tracking and related tracking data.
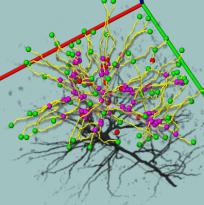
Visualize, Trace, and Count Neurons – NEW
Analyze neurons and other filament structures with the neuron tracing tool in 3D Constructor. Visualize and count the number of branches in a neuron as well as the length and volume of each branch.
Explore Wavelength Overlap with 3D Colocalization
Use Image-Pro’s colocalization tool to indicate which fluorescent regions are to be considered as overlapped, or colocalized. Then activate 3D Constructor to display the colocalized regions in three dimensions.
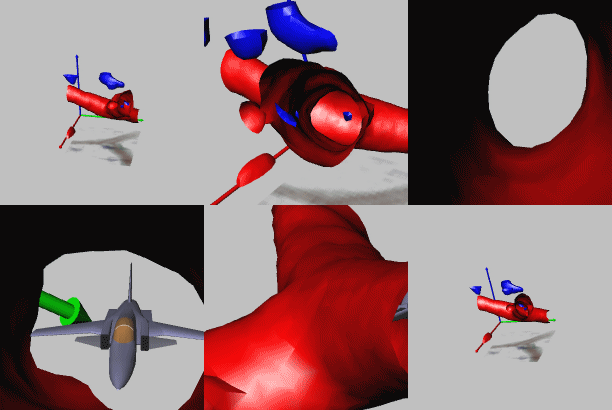
Create Animations of 3D Images
Share your 3D rendered images with others using 3D Constructor’s easy 3D animation creation tools. Create animations with changing transparencies, slide positions, colors, etc. to give others a better understanding of the depth of your 3D image. Save in AVI or multi-frame TIFF or SEQ formats.
Display and Export Image Data
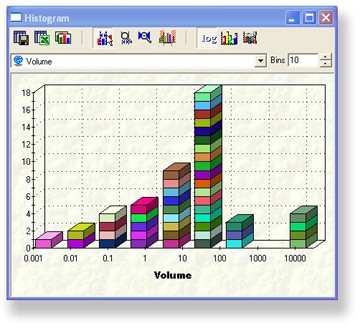
Display and interact with measurement data from individual, histogram, or scatterplot displays. Export 3D measurement data to Microsoft® Excel.
Color-Pro
Color-Pro Plug-in
Accurate Color Rendering for Your Entire Imaging System
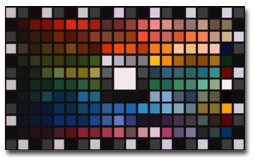
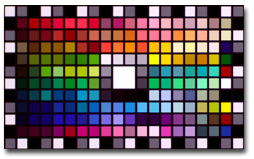
Manage the display of color fidelity of your images within Image-Pro to ensure that you are seeing accurate, consistent colors across your imaging system.
Many analyses are based upon the intensities within each RGB channel for identification, classification and/or quantitation. With Color-Pro color management, you can be sure the color-corrected values will not be compromised.
Key Benefits
• Consistent Color – Feel confident that the colors you see through your microscope eyepiece are the same colors you see on your monitor.
• Better Quantitative Results – Free yourself from relying on personal observation for qualitative interpretation and move towards greater automation and quantitative results. Color-Pro is particularly valuable for pathologists, production facilities, and others who rely heavily on color interpretation to make important decisions.
Features
Color-Pro Plug-In Module Features
• Every image can have its own color space.
• Allows ICC profiles for input devices (like a camera), display devices, light sources and output devices to be corrected automatically or applied to collected image files in order to maintain accurate color rendering.
• Color profiles associated with images can be saved/loaded in TIFF files.
• Convert images from one color space to another.
• Measure XYZ and L*a*b* colors according to the assigned image color space.
• Includes ICC profiles for cameras supported by the Image-Pro family (Image-Pro Plus, Image-Pro Discovery, and Image-Pro Express)
Color-Pro Plug-in Module Kit Includes:
• Color-Pro Plug-In Module for Image-Pro 5.0 family of products
• Eye-One Monitor Profile Package
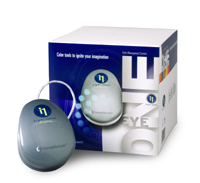
GretagMacbeth Eye-One Monitor Profile Package
The Eye-One Monitor Profile Package includes a colorimeter and software that enables you to adjust your monitor to display consistent, predictable color. The Eye-One Display compact colorimeter measures the color output of your monitor – both CRT and LCD. The Eye-One Match 2.0 Software works effortlessly with the Eye-One Display to build an ICC profile.
* Profile Package features include:
• USB powered
• Use at multiple workstations at no additional licensing fee
• Includes counterweight for easy use with any CRT or LCD monitor.
• Macintosh and PC compatible – Classic, OS X, Windows 2000, XP Professional
(Image-Pro products are only available for the PC)